Tabula: Ask a Question, Get a Dashboard
An open source design system I designed and built for data-dense products, with an AI front door. You ask a question in plain words, and a model composes a dashboard from Tabula's own components while the code checks its choices and computes every figure.
A question in plain words becomes a dashboard
Ask the data is the home page of the templates. You type a question in plain words and get back a dashboard built from Tabula's own components. A follow-up such as "only Europe" changes the dashboard on screen.
The user is a manager who needs a view the standard dashboard does not have. Today they ask an analyst and wait a day, or they paste figures into a chatbot and cannot check what comes back. They need that view in seconds, and they need to trust every figure on it.
The model chooses, the code checks and computes, and the person decides.
The model chooses
The model decides whether the data can answer at all, and asks one question back when the question is too vague. It picks the scope, which is the period, the place, the products and the comparison, and up to six widgets from twelve kinds. It answers in a fixed JSON shape, and it never writes a figure or any markup.
The code checks and computes
The code computes and formats every number, and it picks the chart, the time steps and the layout. When the data cannot draw a view, the code cuts it and says why in a plain sentence, such as "site visits are not counted per product".
The person decides
Every widget has a button that shows the exact queries behind it, and every answer shows what the model returned, word for word. A follow-up lists what changed, and Undo puts the previous dashboard back.
The design system as a vocabulary
The model composes the interface from the design system's components, so the system works as a vocabulary a model can use. The twelve widget kinds are key figures, a trend, a breakdown, a table, a country or product scatter, the product mix, a calendar of busy days, a funnel, orders by weekday and hour, an account list, accounts by segment and status, and accounts by size.
Edge cases are designed in
A vague question gets a question back. A forecast such as "next quarter" gets a sentence saying the data cannot answer that, with questions it can answer. A split the data cannot make is cut, with a note.
An LLM that builds interfaces from a design system
The live version runs on Gemini 2.5 Flash-Lite. The open source version runs Gemma 4, a 12 billion parameter model, on your own computer through Ollama.
Ask the model in your own words
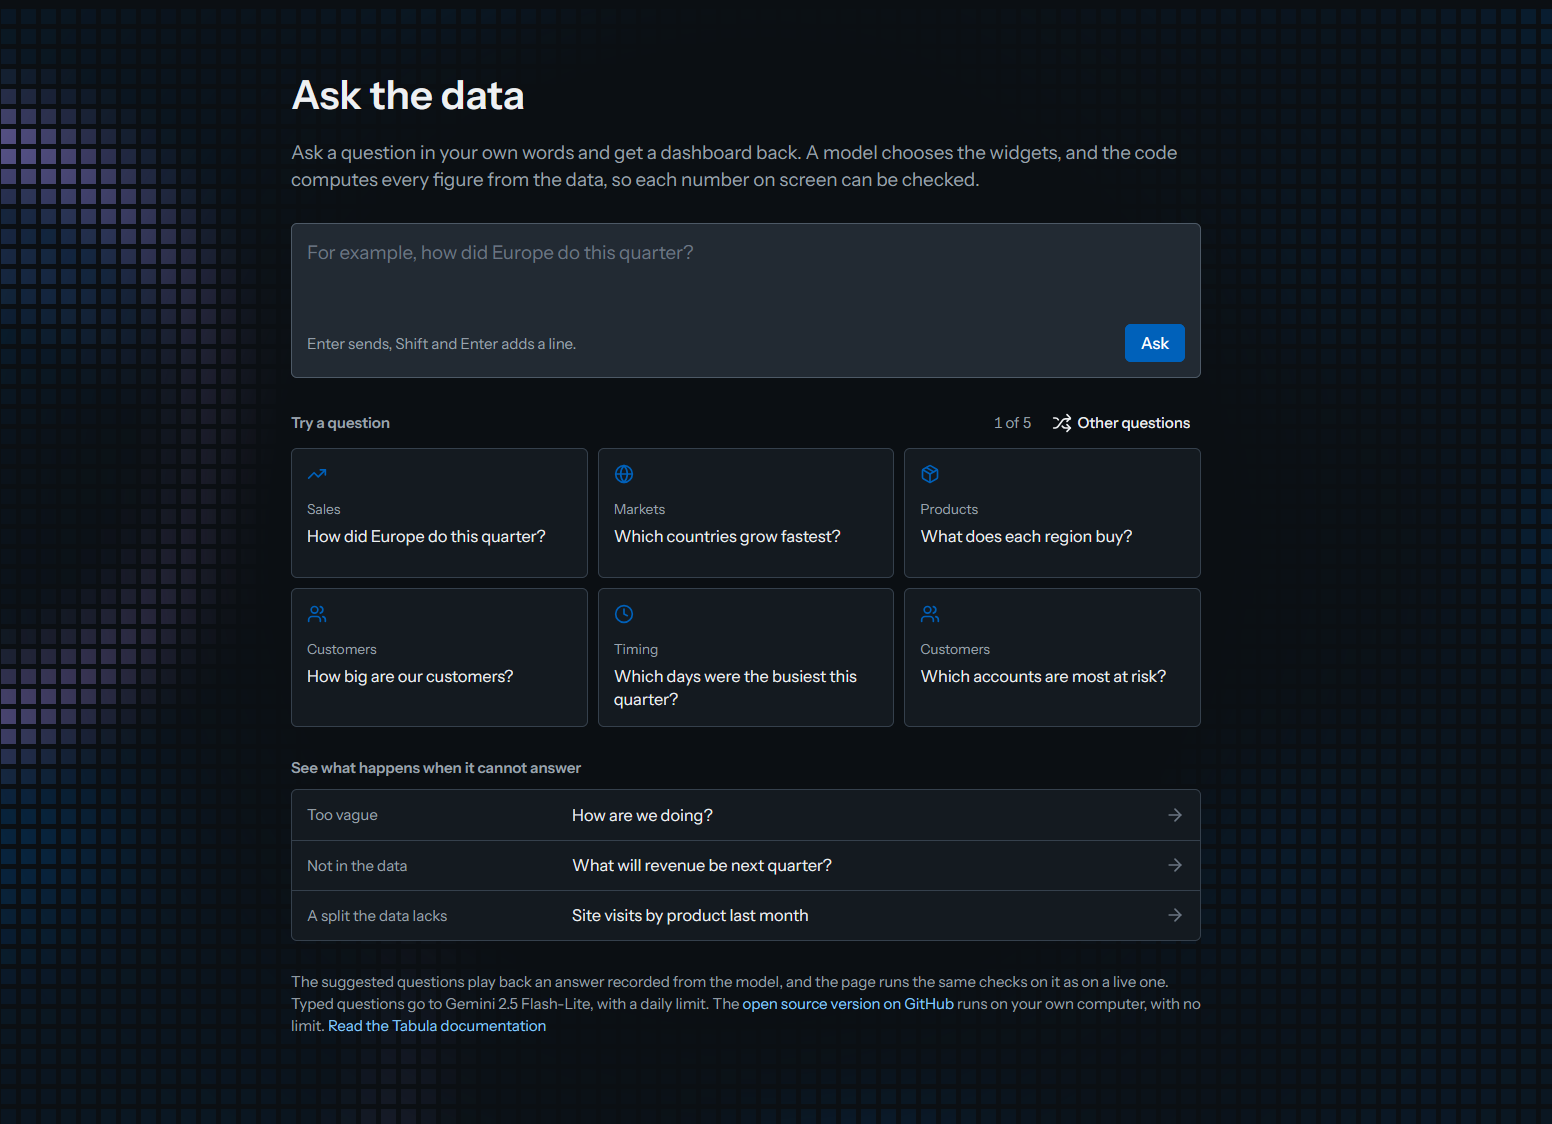
The start page is a prompt box with suggested questions for people who do not know what to ask. There are 25 of them, shown six at a time, and three more show what the model does when the data cannot answer.
The suggestions play back 85 answers recorded from the model, and every one goes through the same checks as a live answer, so they load at once. An animated heatmap sits behind the page until the first question.
The model composes the dashboard
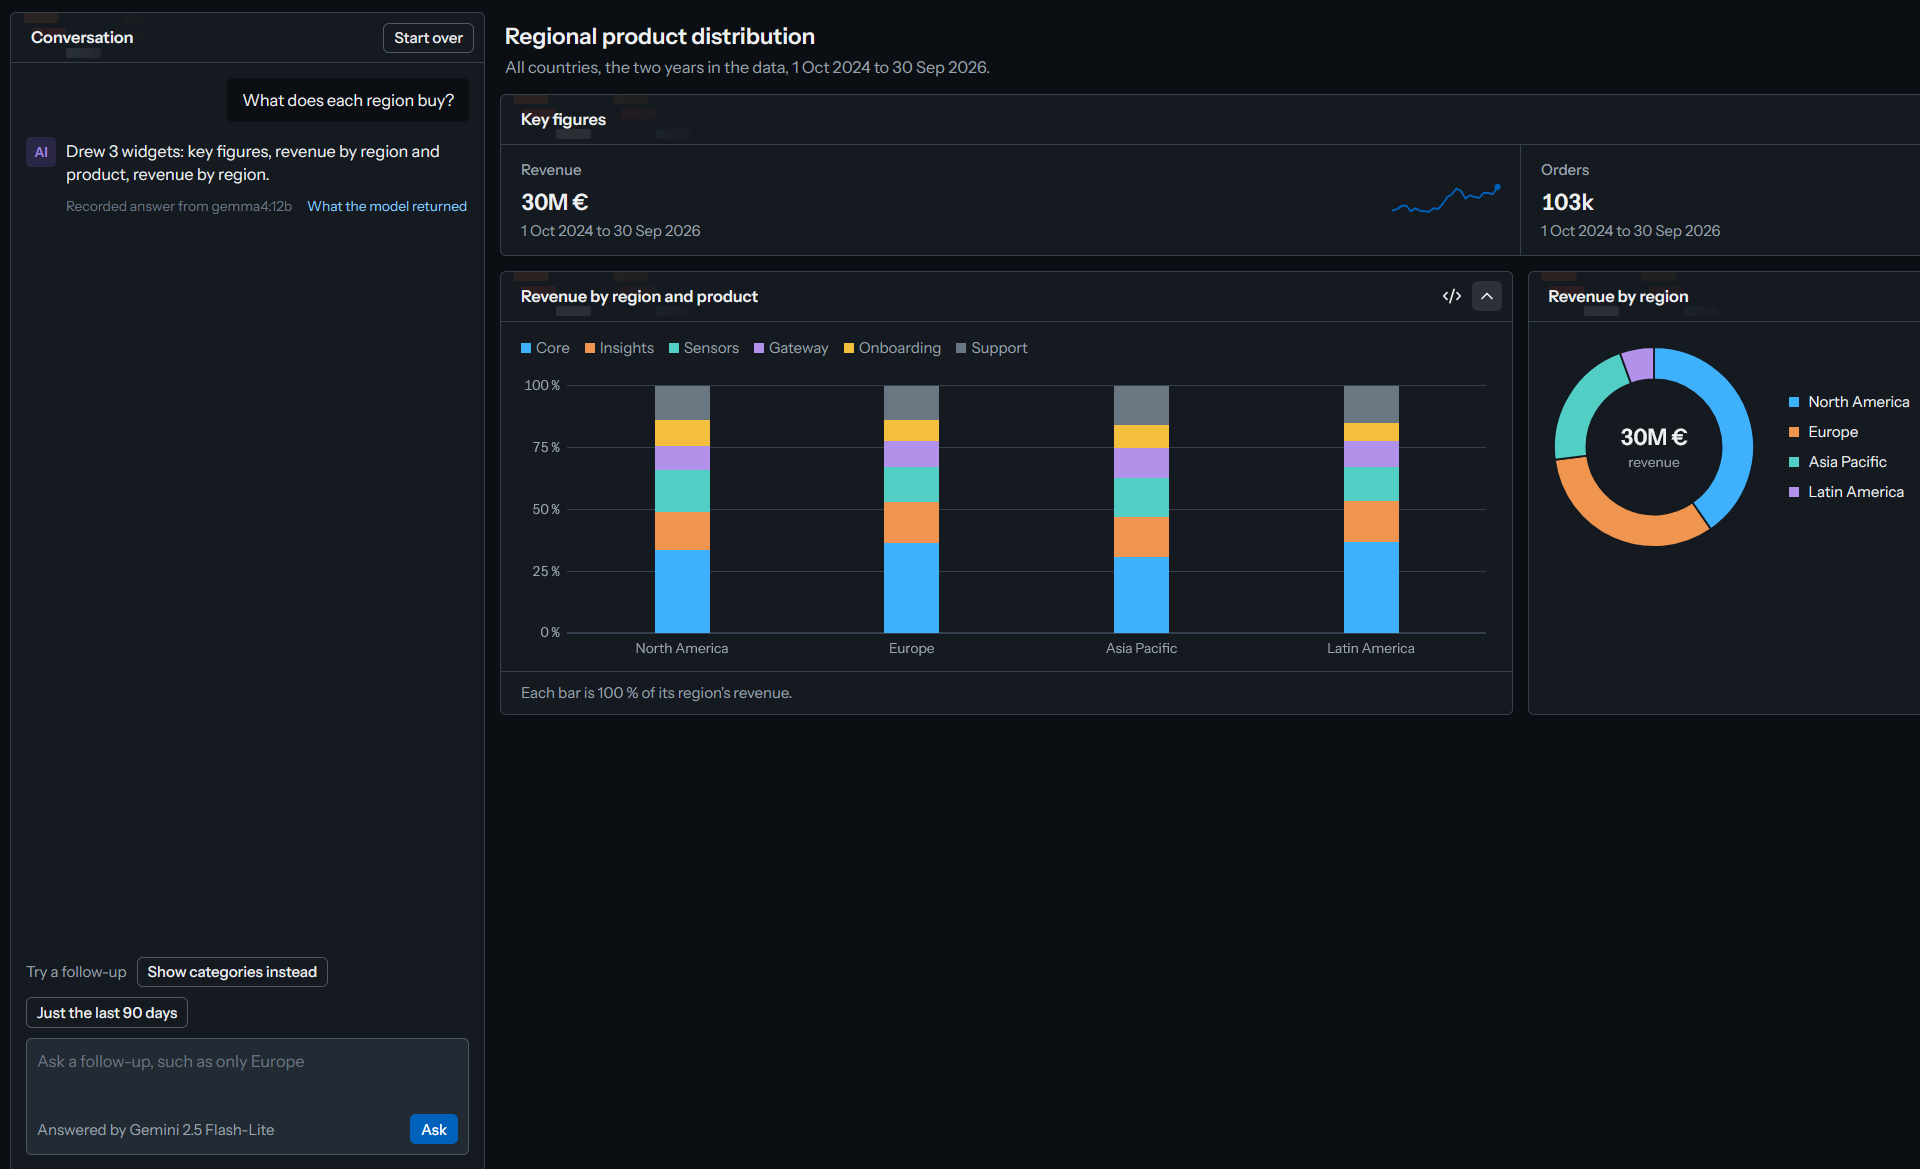
For "What does each region buy?" the model returned three widgets in JSON, and the page drew them from Tabula's components. Every figure on screen was computed by the code from the data.
The link under each answer shows what the model returned, word for word, and the code button on each widget shows the queries behind it.
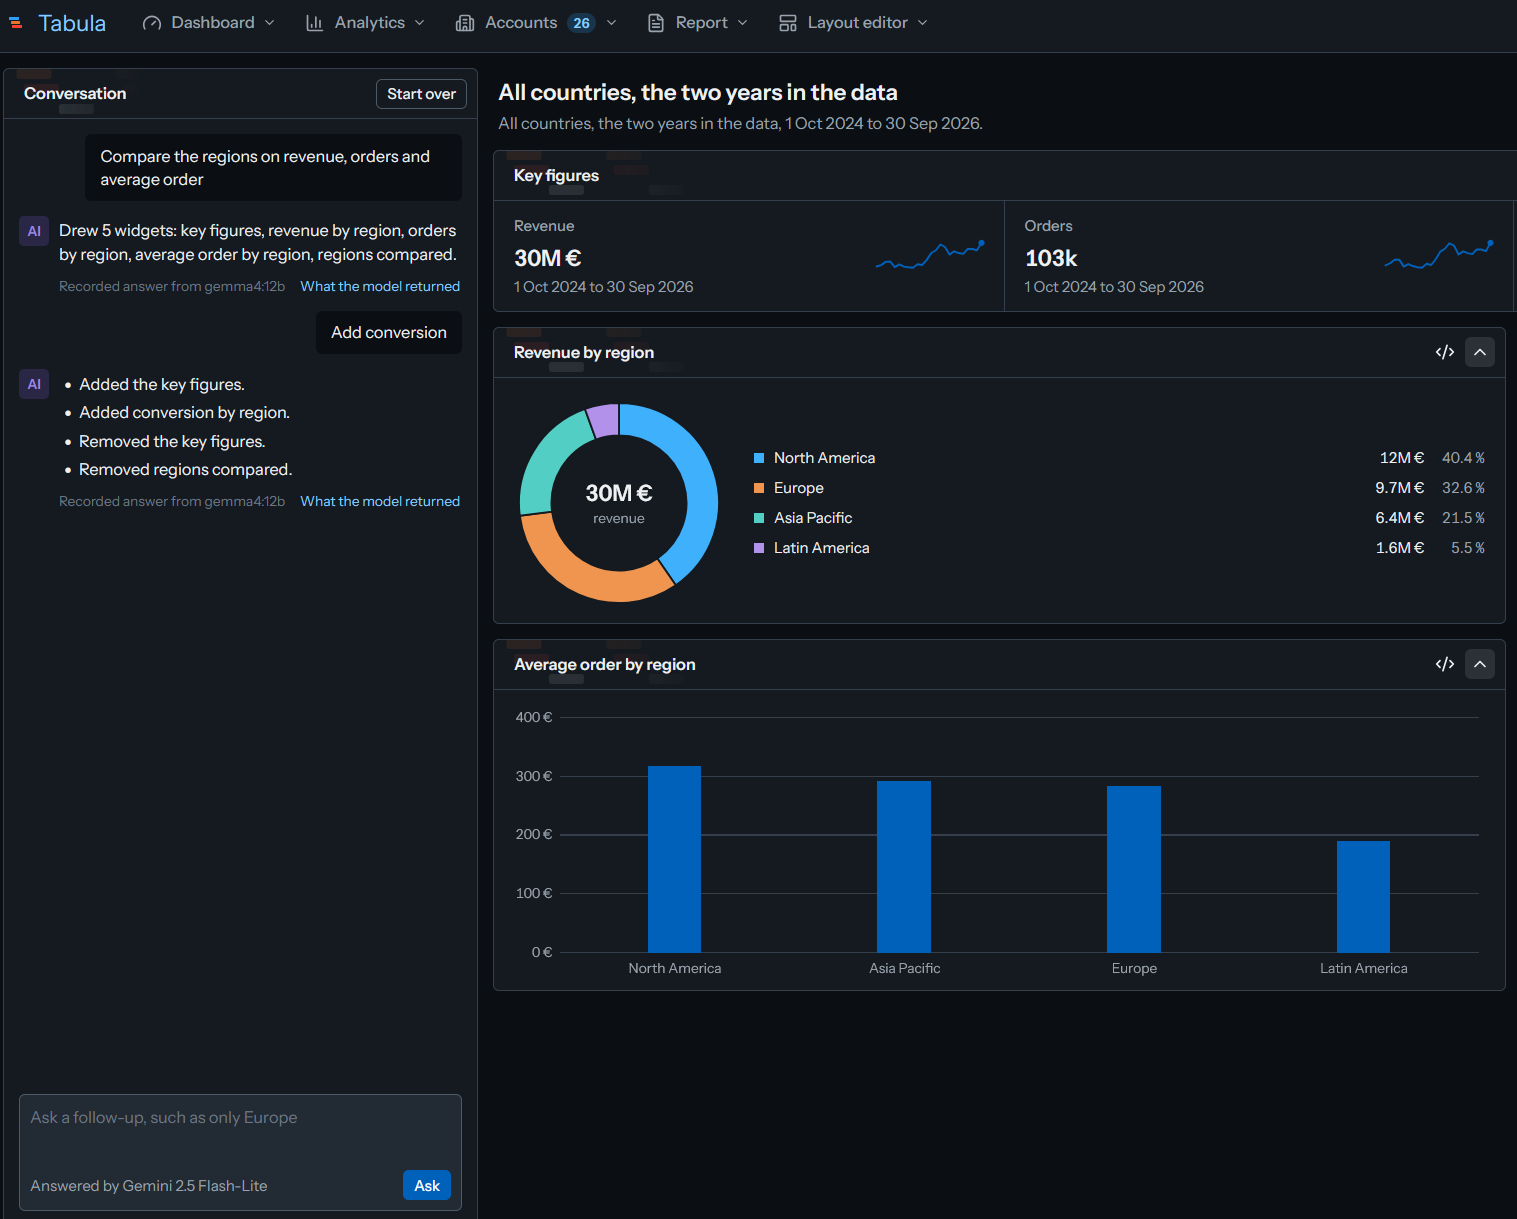
A follow-up edits the dashboard on screen
A follow-up goes to the model with the dashboard on screen and the earlier questions. The model changes the dashboard in place, and the conversation lists what it added and removed. Undo puts the previous dashboard back.
Built for the person deciding whether to use it
The user of Tabula is a designer or front-end developer choosing a design system for their own product. Before they commit, they need to see it hold up on realistic screens full of data and charts, and they need a page they can lift as a starting point.
So I built it around six template pages that share one seeded set of generic business data: 480 customer accounts in 16 countries, six products, and two years of daily revenue, orders and visits.
Every figure on every page is computed from that data, and none of it is typed in.
Everything is a token or a class
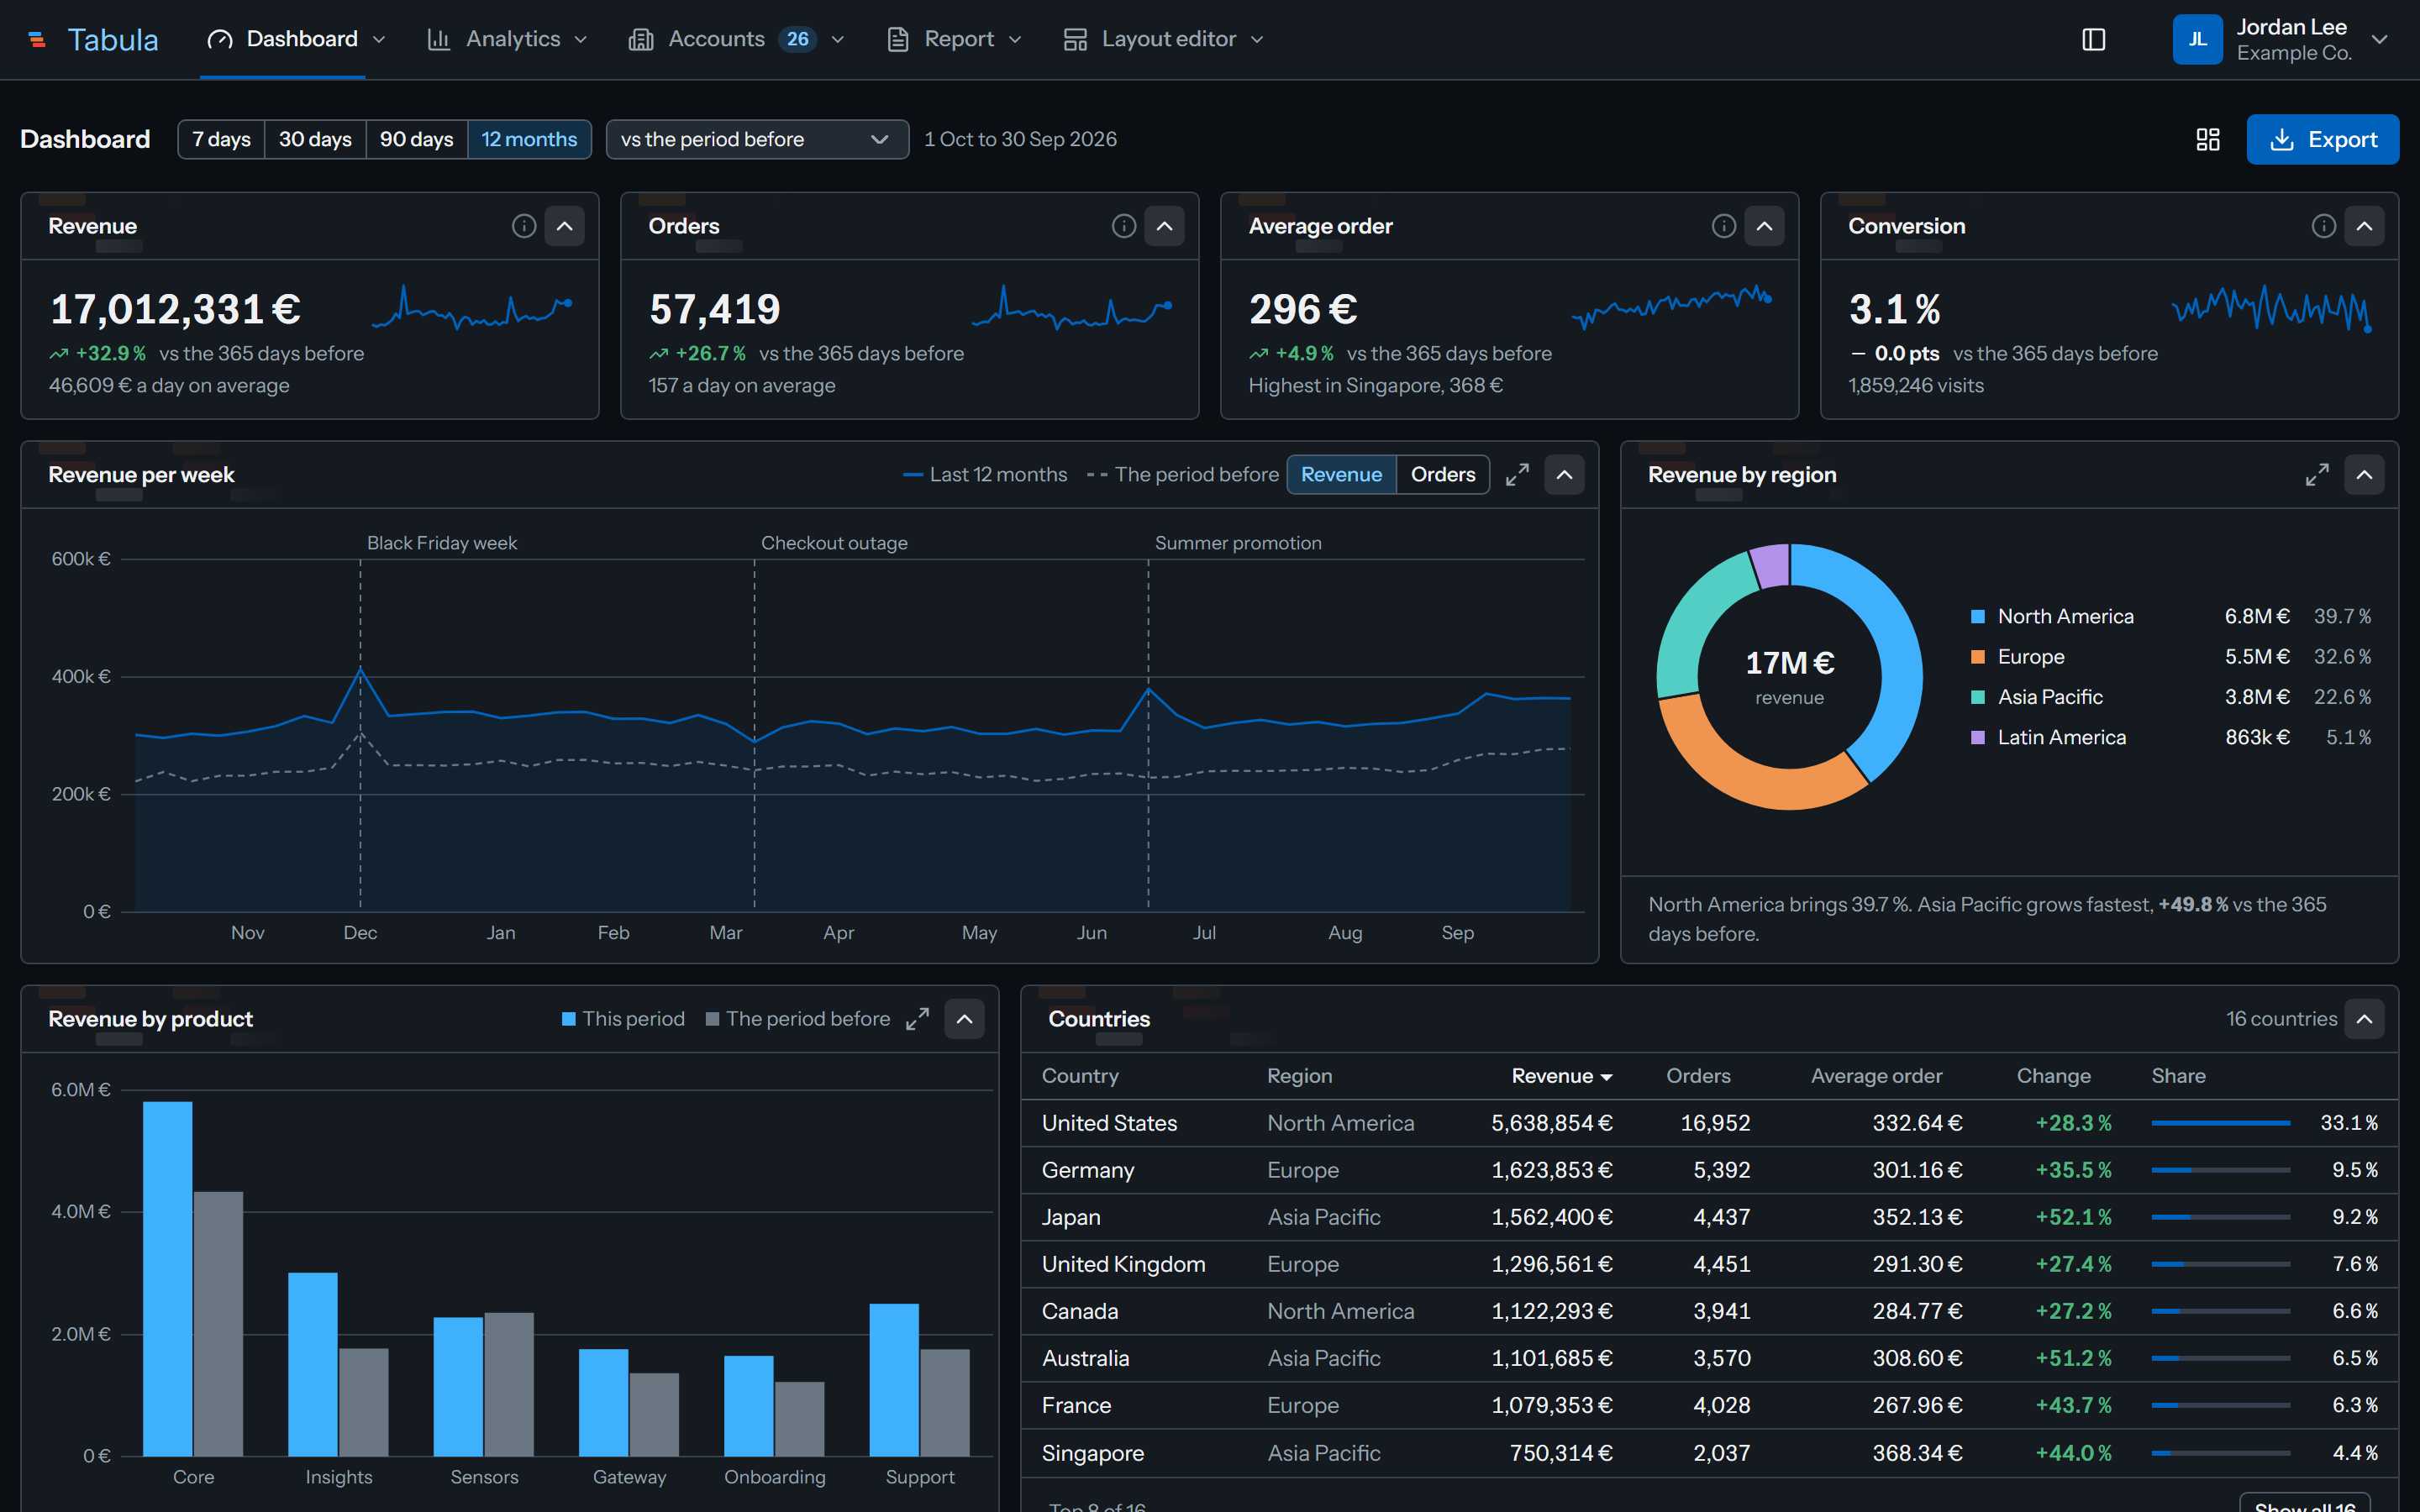
Every part of Tabula is a token or a class with the tb-prefix, so it drops into any front end. A thin behaviour layer in plain JavaScript handles interaction, and React wrappers are optional.
The 150 tokens are 57 palette values behind 93 role tokens, and six of those roles are chart series colours. The dark theme is a single class,tb-dark, which redefines 40 roles and changes nothing else.
A quiet brand
The logo is a stack of three tablets. A tabula is a tablet to write on, and a stack of them reads as a stack of rows. A faint tile of small stacks sits behind every card header, and every label is in sentence case.
16 components
- 8 controls
- 8 surfaces
19 patterns, among them
- The app shell
- Edit mode with a widget catalogue
- A timeline
- The chart library and tree views
An app shell that remembers
The top bar docks to a left sidebar with a view transition and collapses to an icon rail. It carries submenus and an account menu with the theme switch, and it remembers every one of those choices.
Six pages on one set of data
Each template is a page someone could copy into their own product and start from. Together they cover the screens a data-dense product needs.
Charts that filter each other
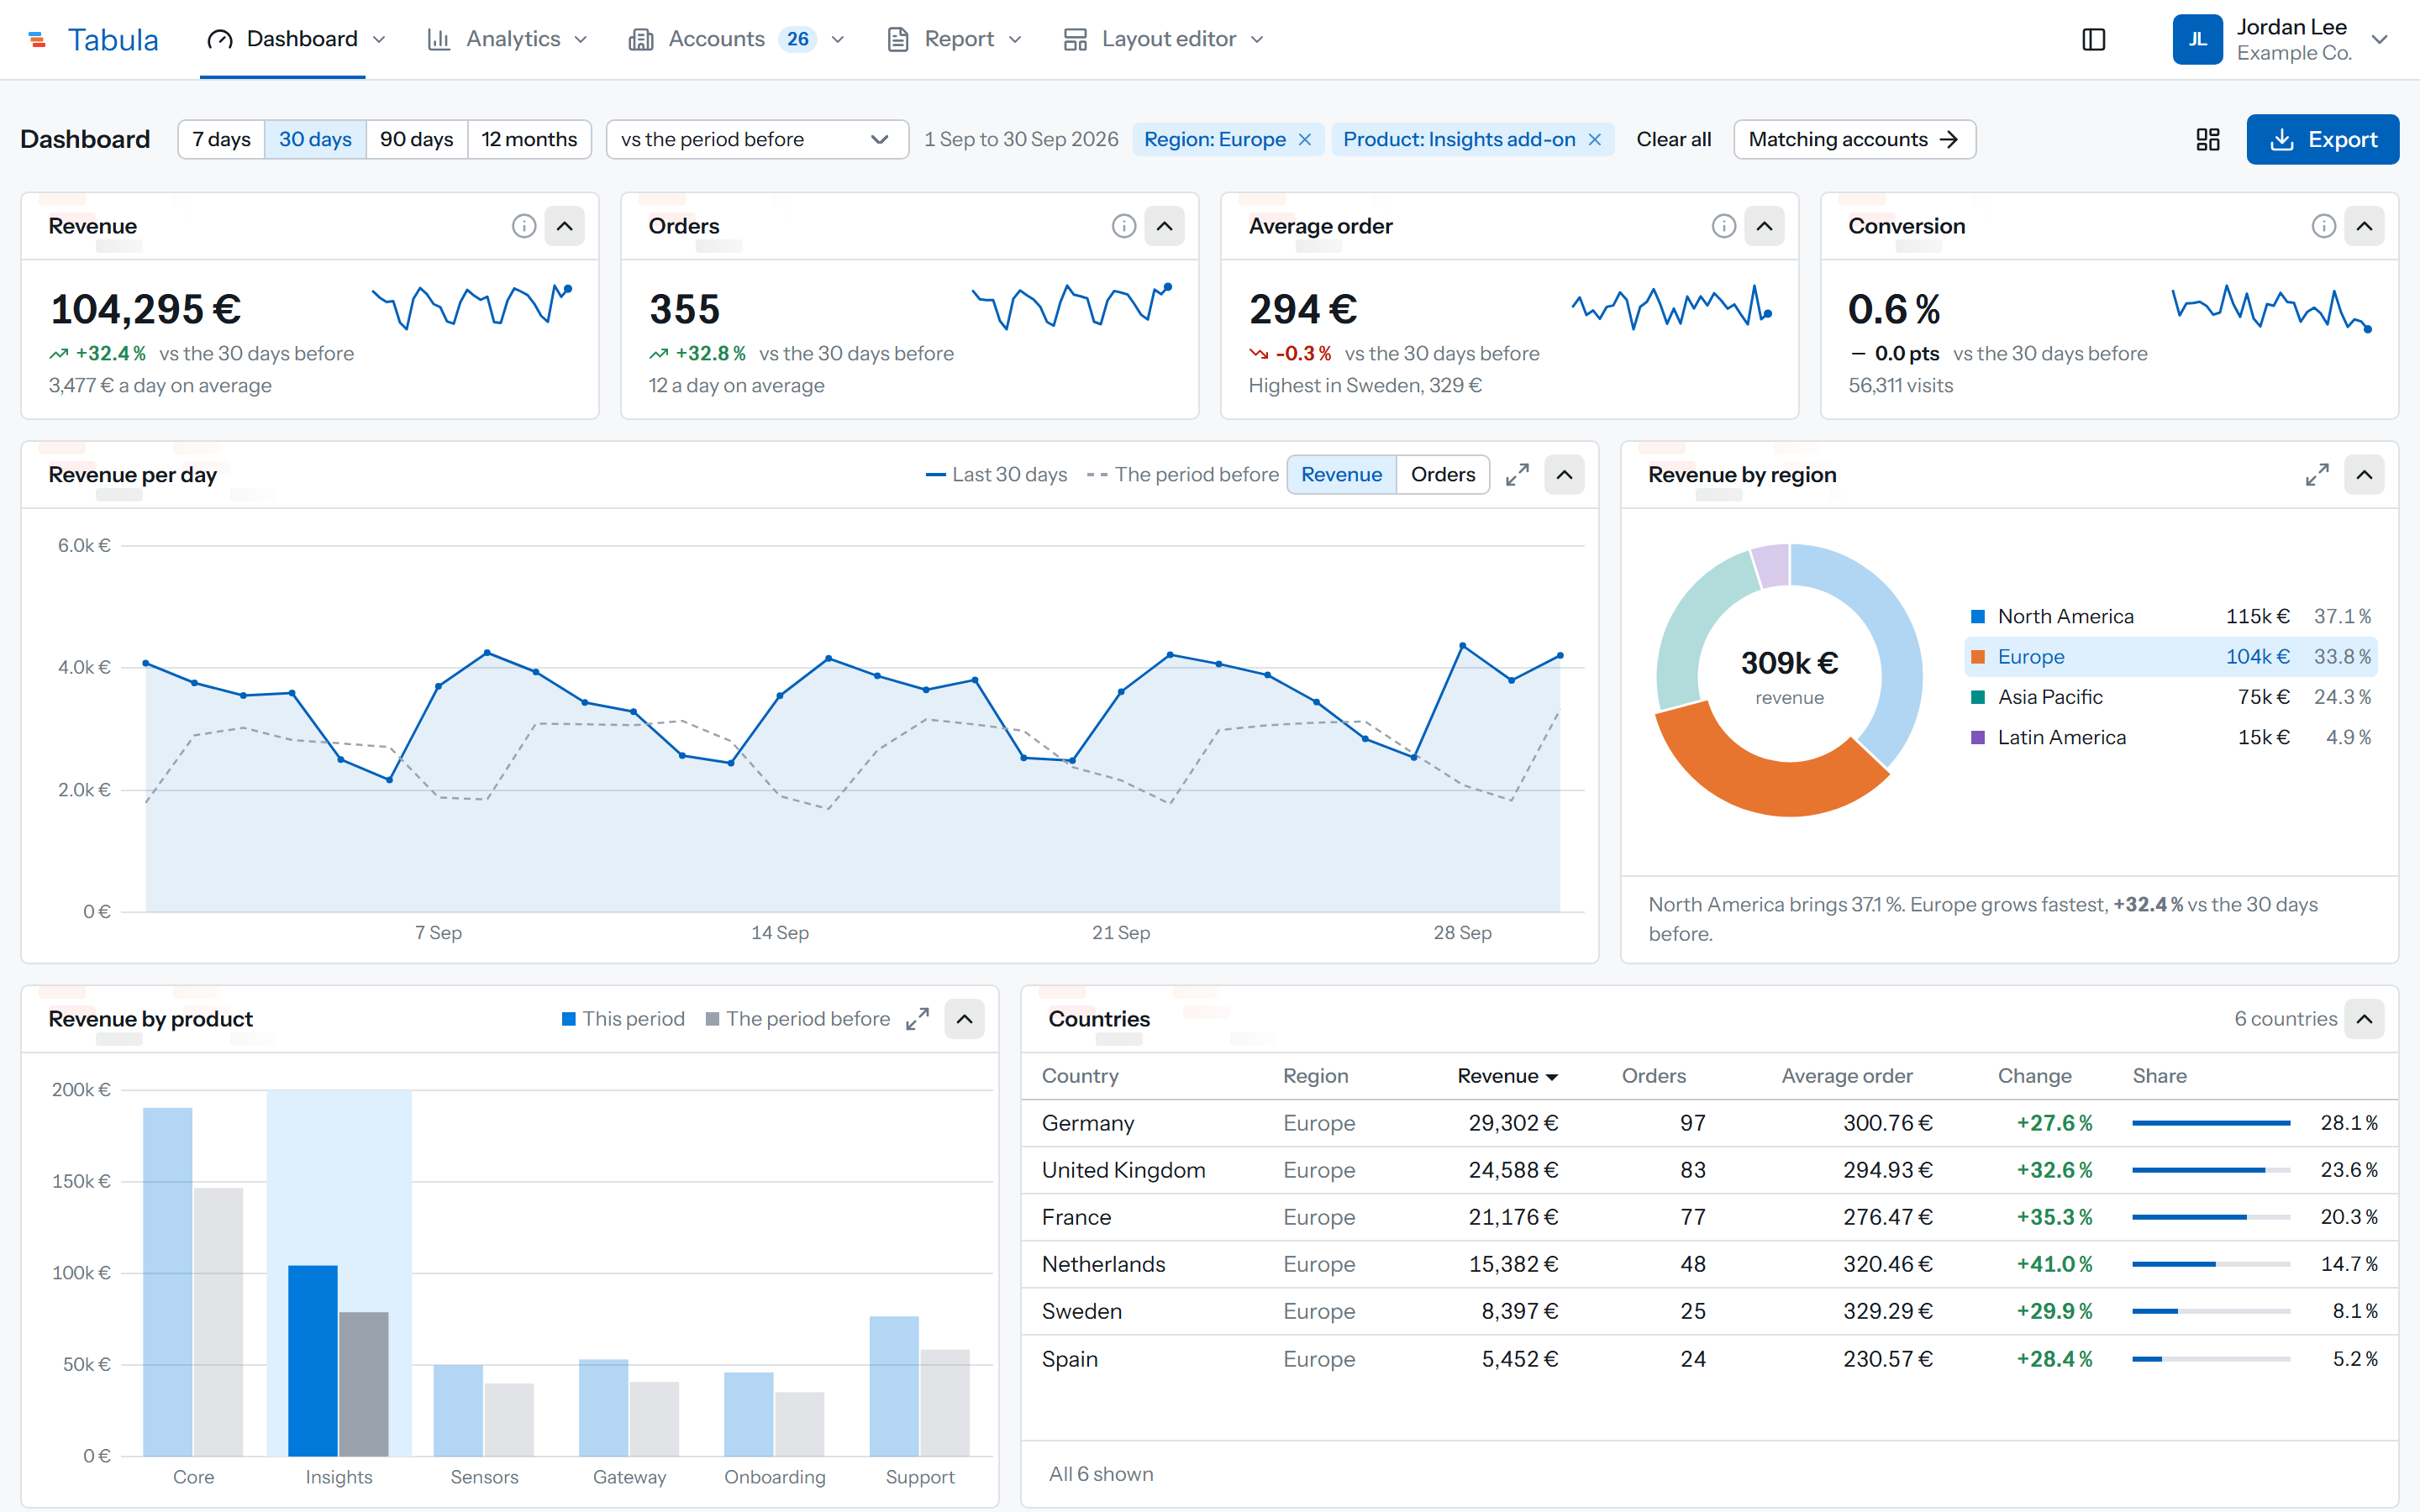
Key figures with sparklines sit above revenue against a comparison period, a region donut, product bars and a country table. Selecting a region or a product filters every other chart, and the layout is editable.
The chart library on one page
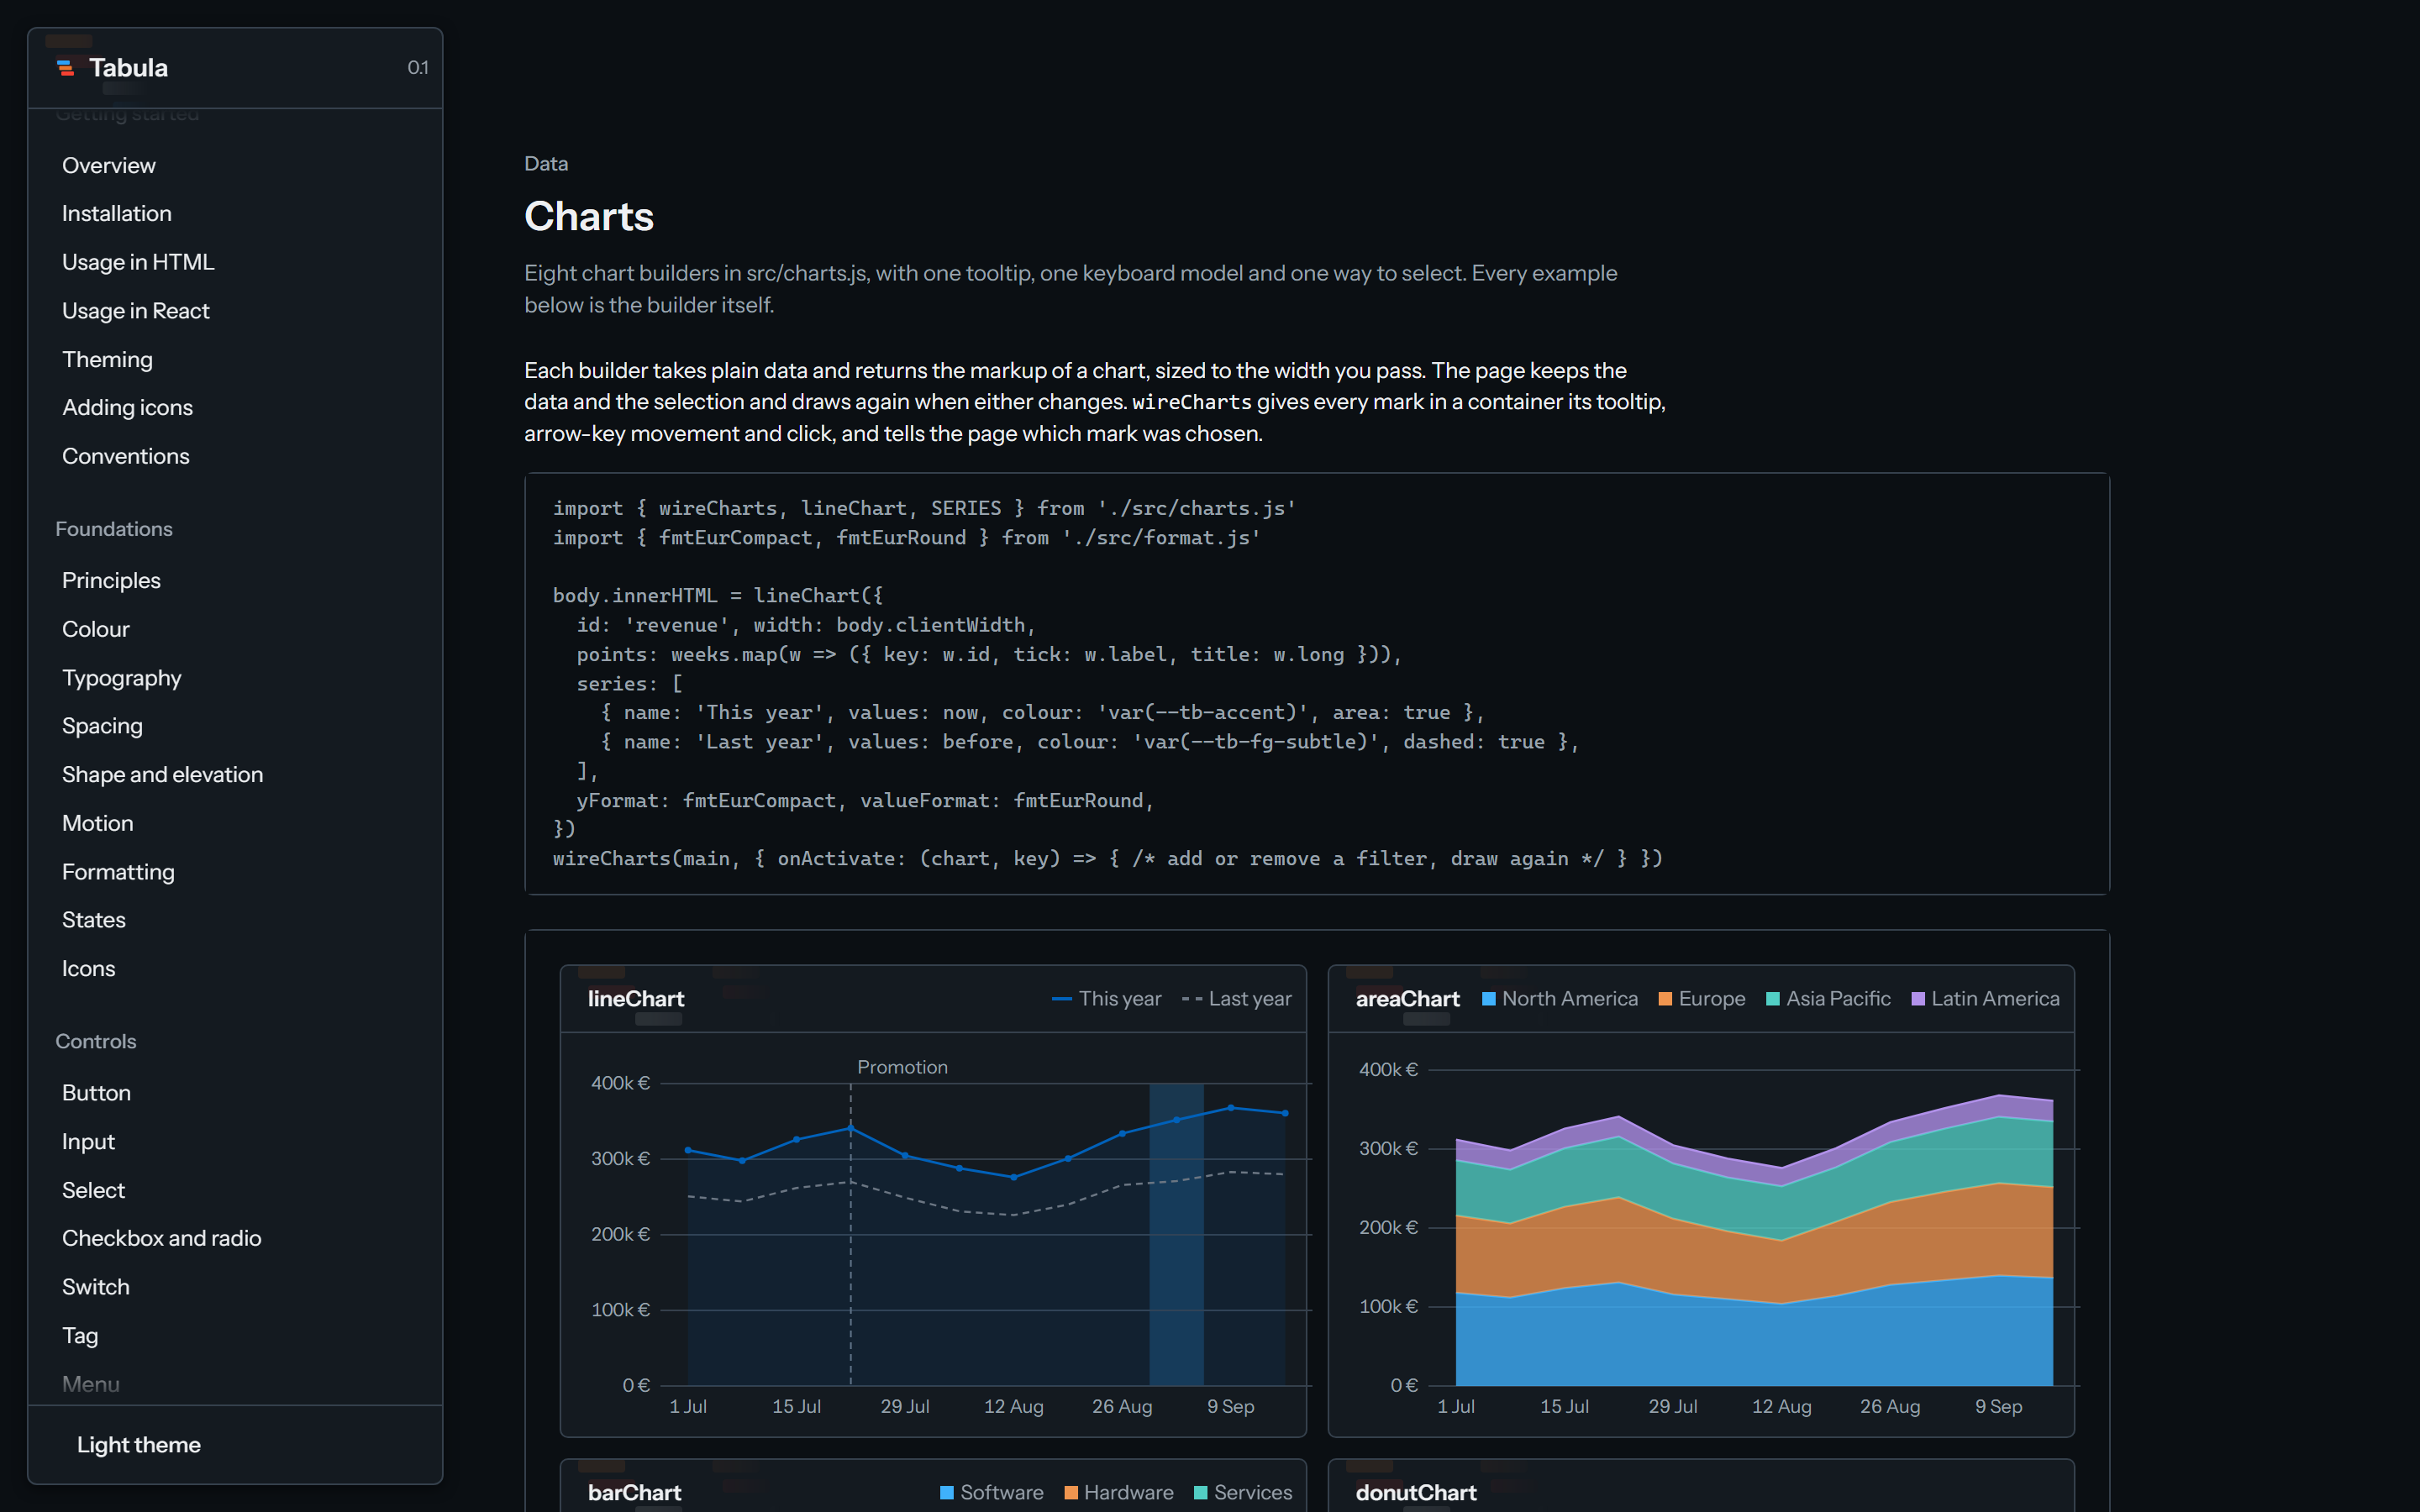
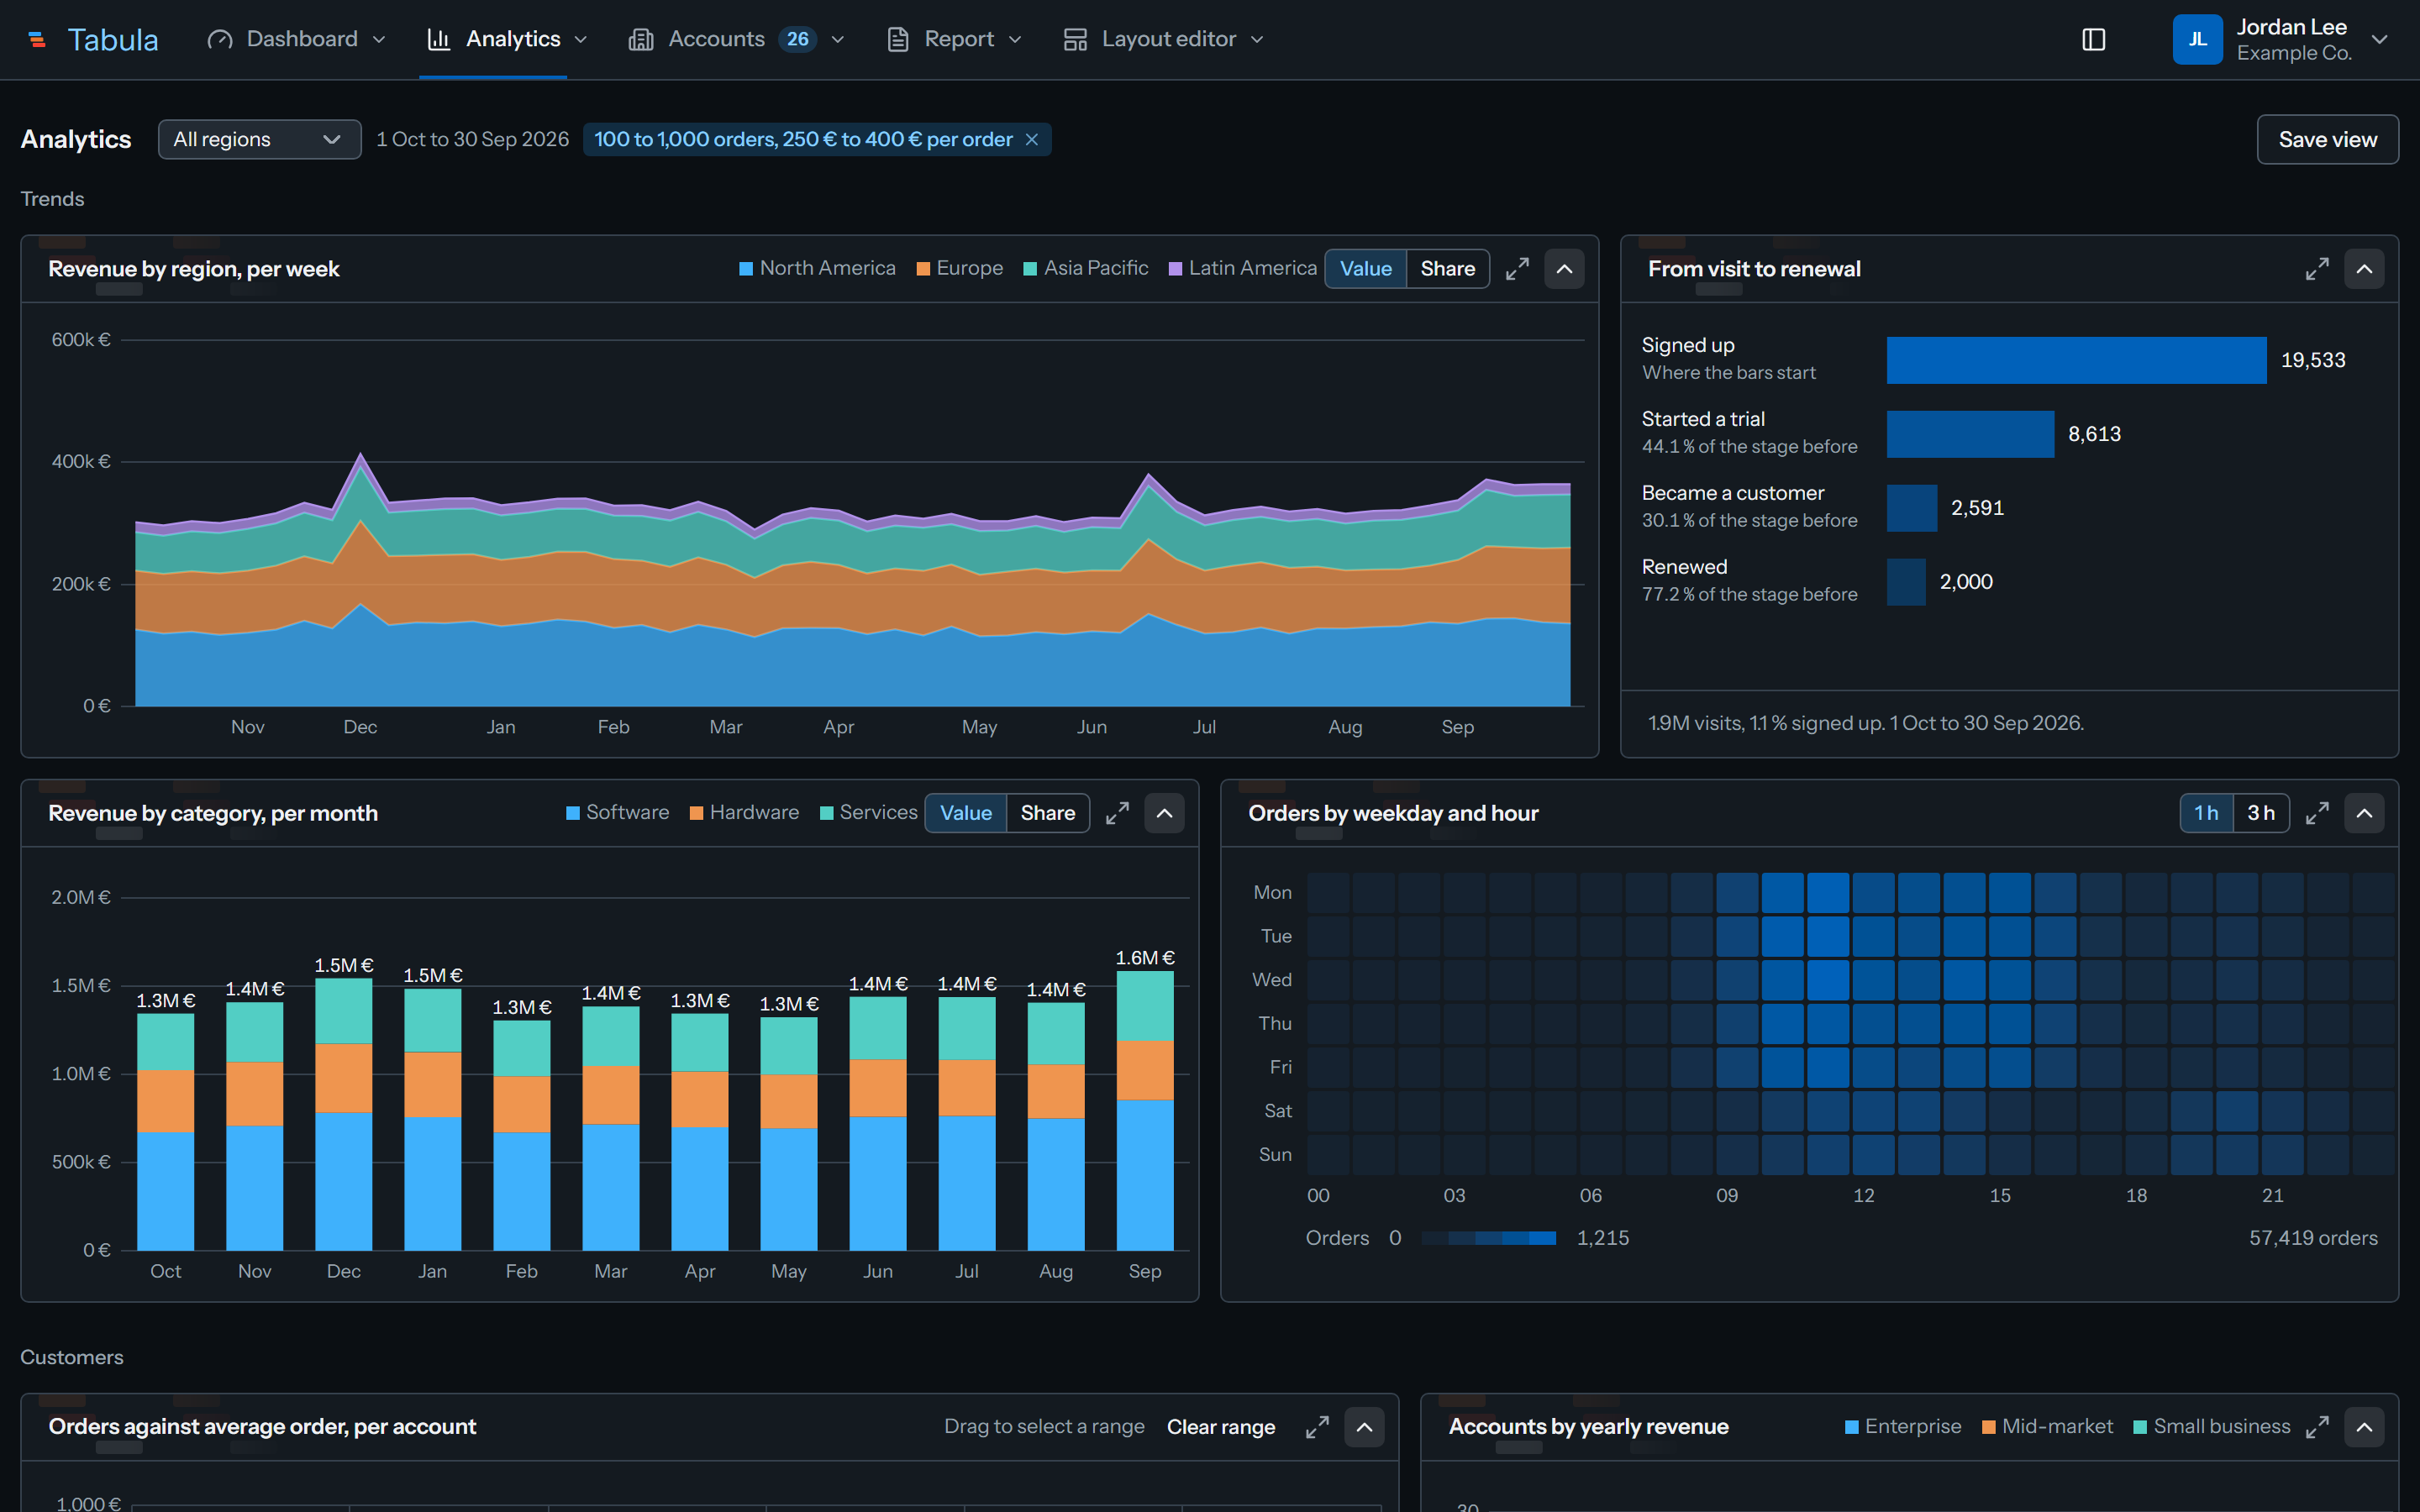
This page runs a stacked area, a funnel, stacked bars, a weekday by hour heatmap, a scatter with a brush to select a range, and a histogram. All eight chart builders are hand-drawn SVG. They share one tooltip, one keyboard model and one set of number formatters, and they use tokens only.
Below the charts, the revenue hierarchy is read four ways, as a tree, columns, an icicle or a table. Branches expand and collapse with animation, the view zooms with the wheel, and a closed branch is drawn as a deck.
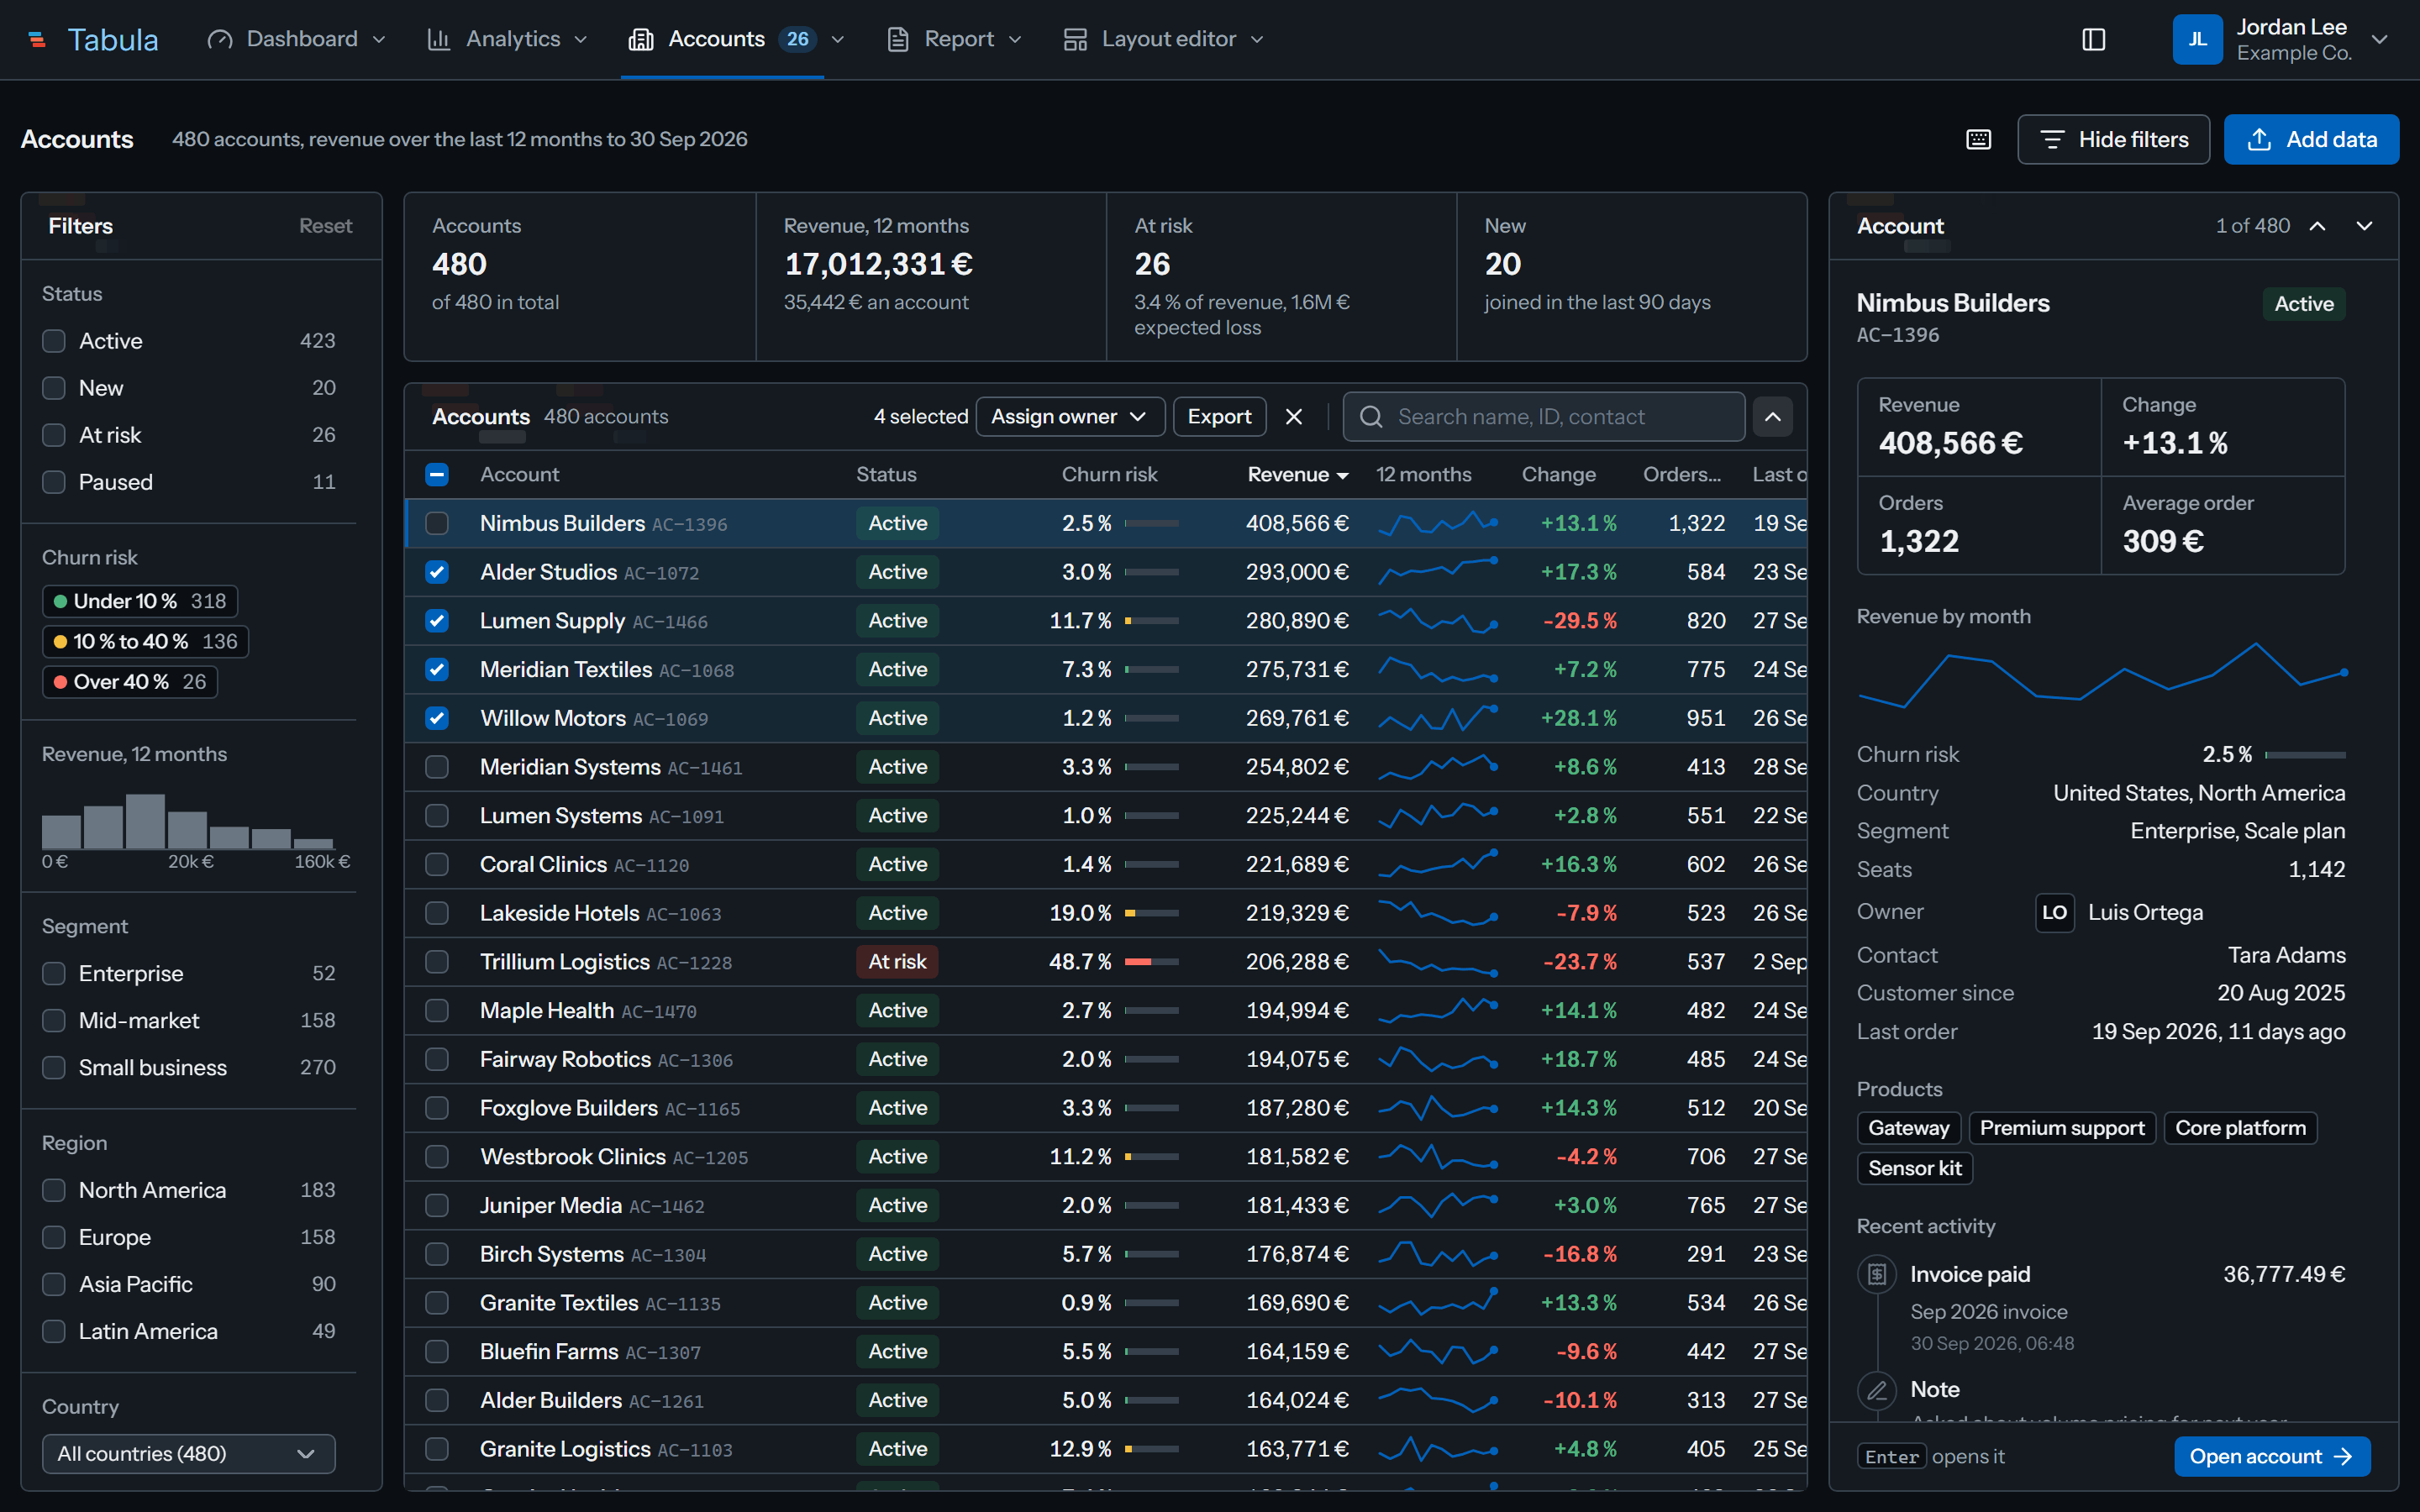
A table built for a working day
The page fits the window with three panes that scroll on their own: a filter rail with live counts, the table, and a detail pane. It has sorting, row selection with bulk actions, sparklines in cells, and J and K to move between rows. Add data takes files by drag and drop and shows import progress on each row.
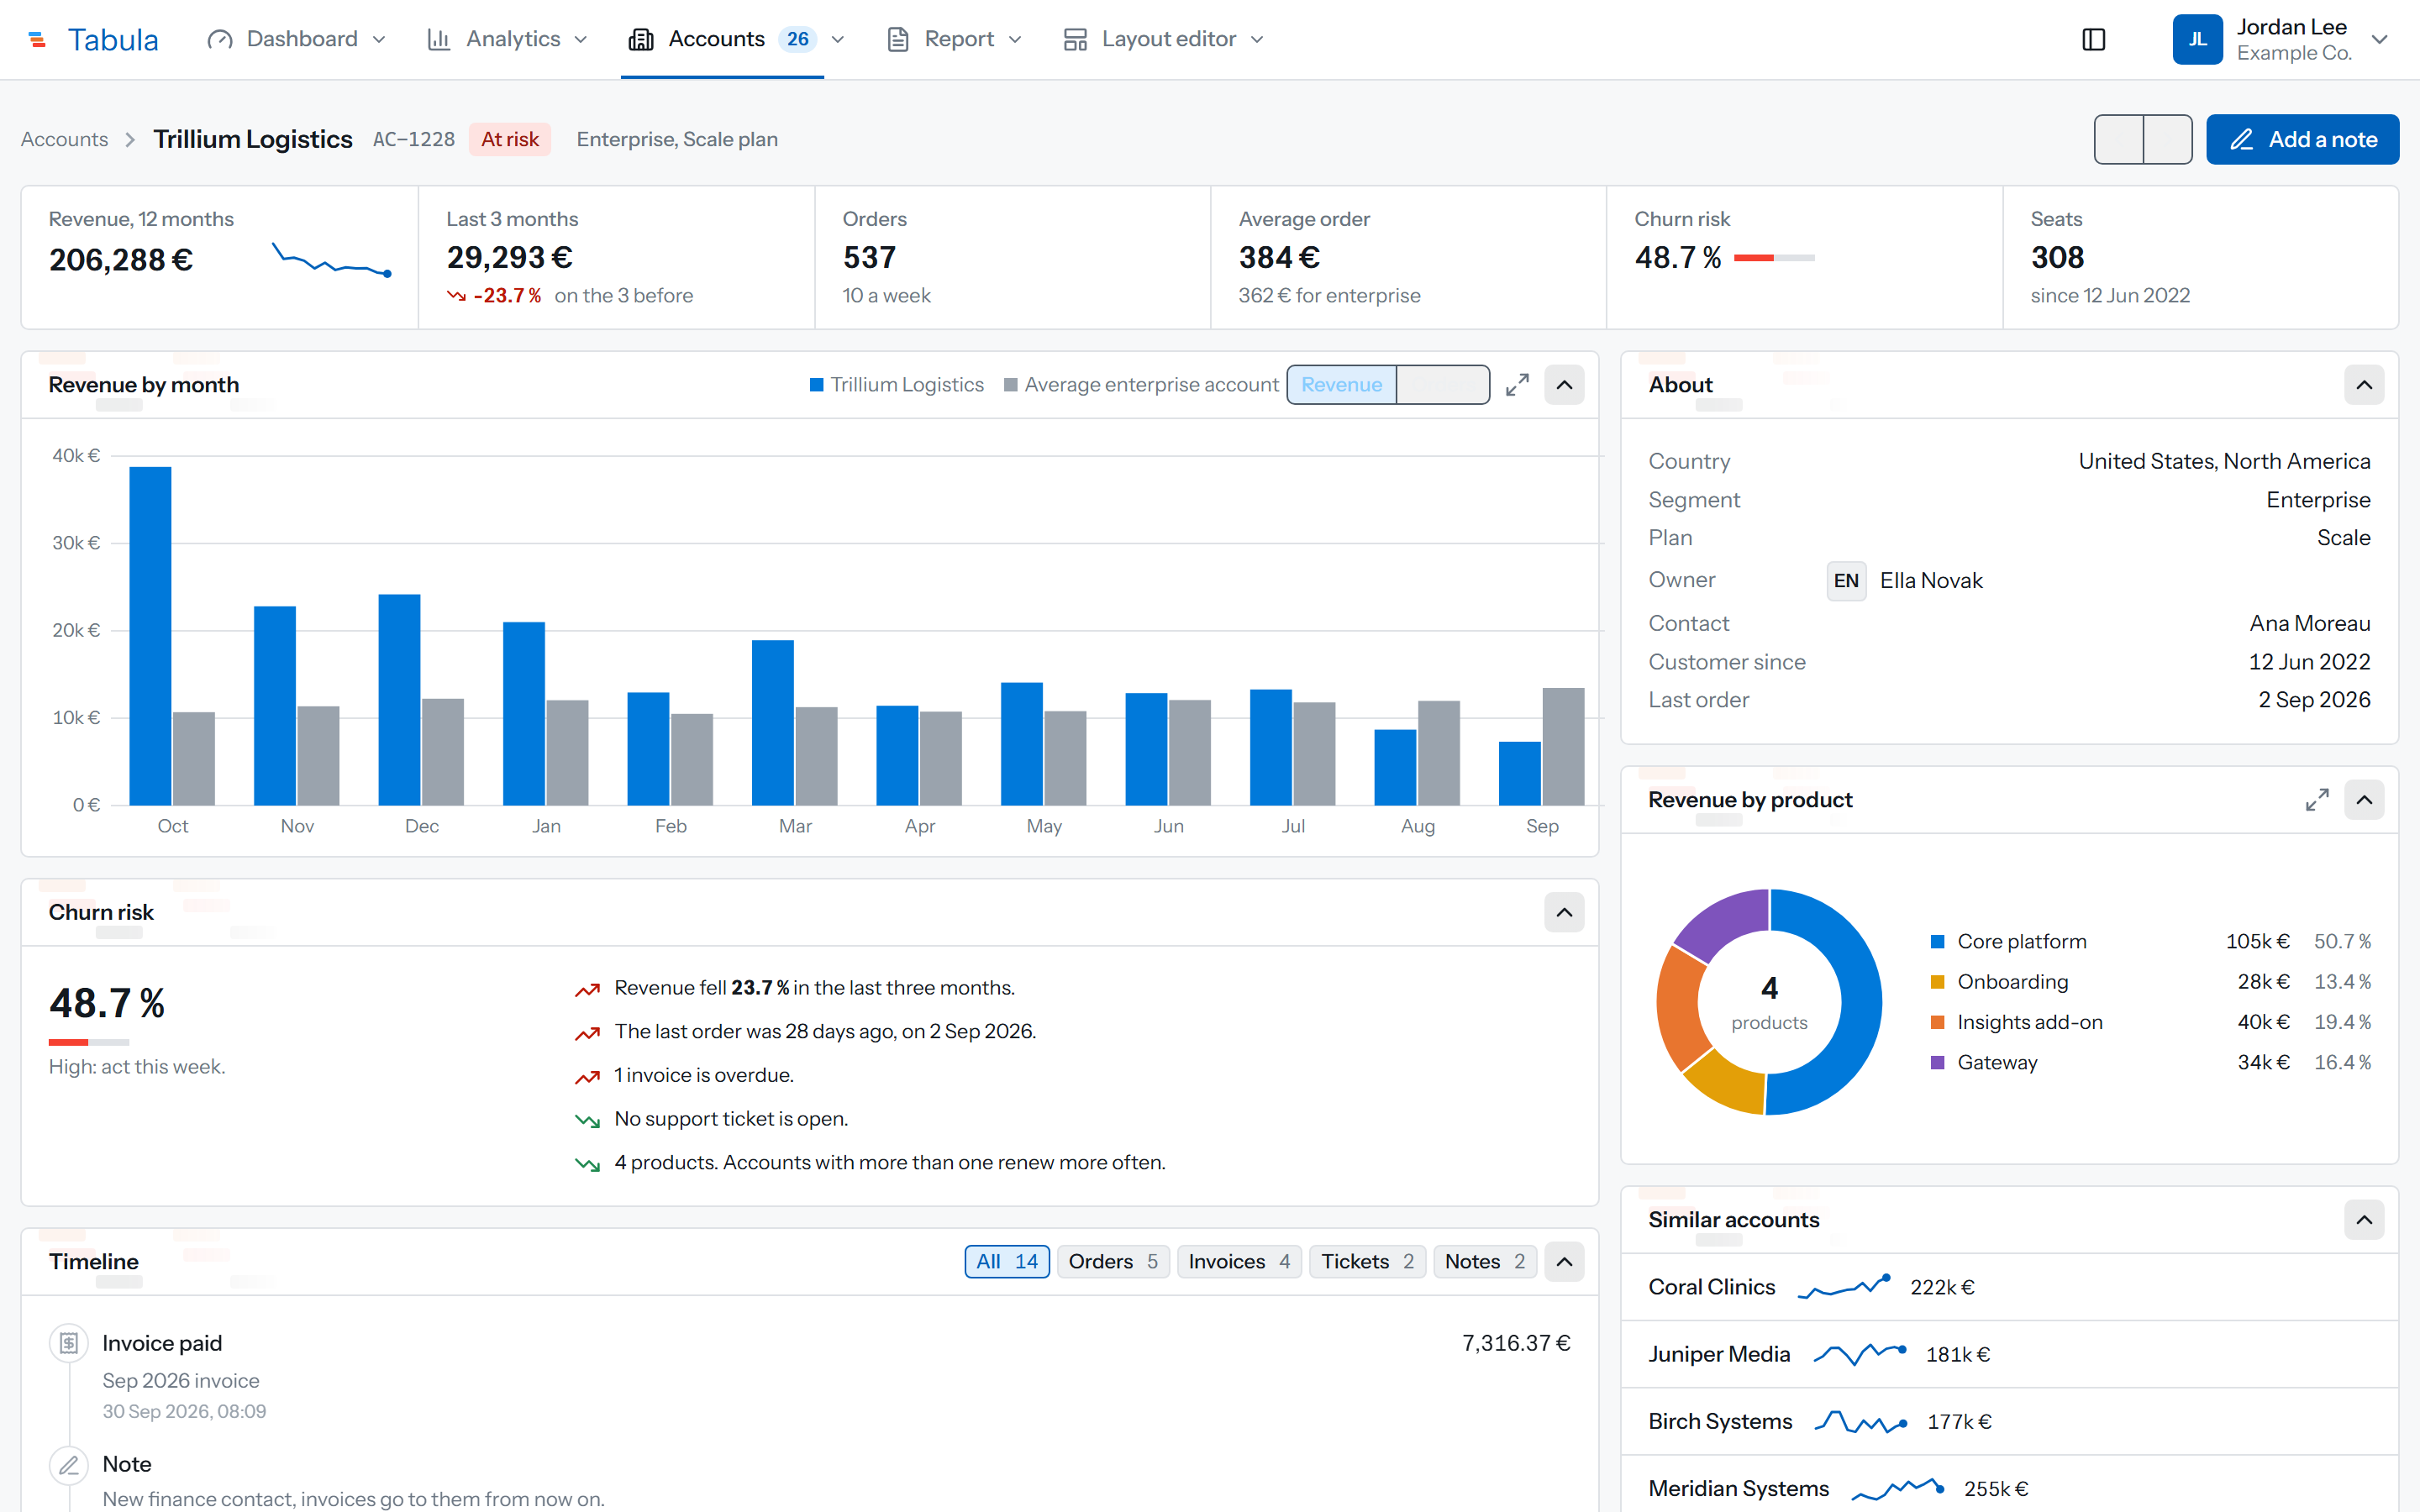
One account in full
A single account shows its churn risk and what drives it, a timeline of activity, revenue by product and a list of similar accounts.
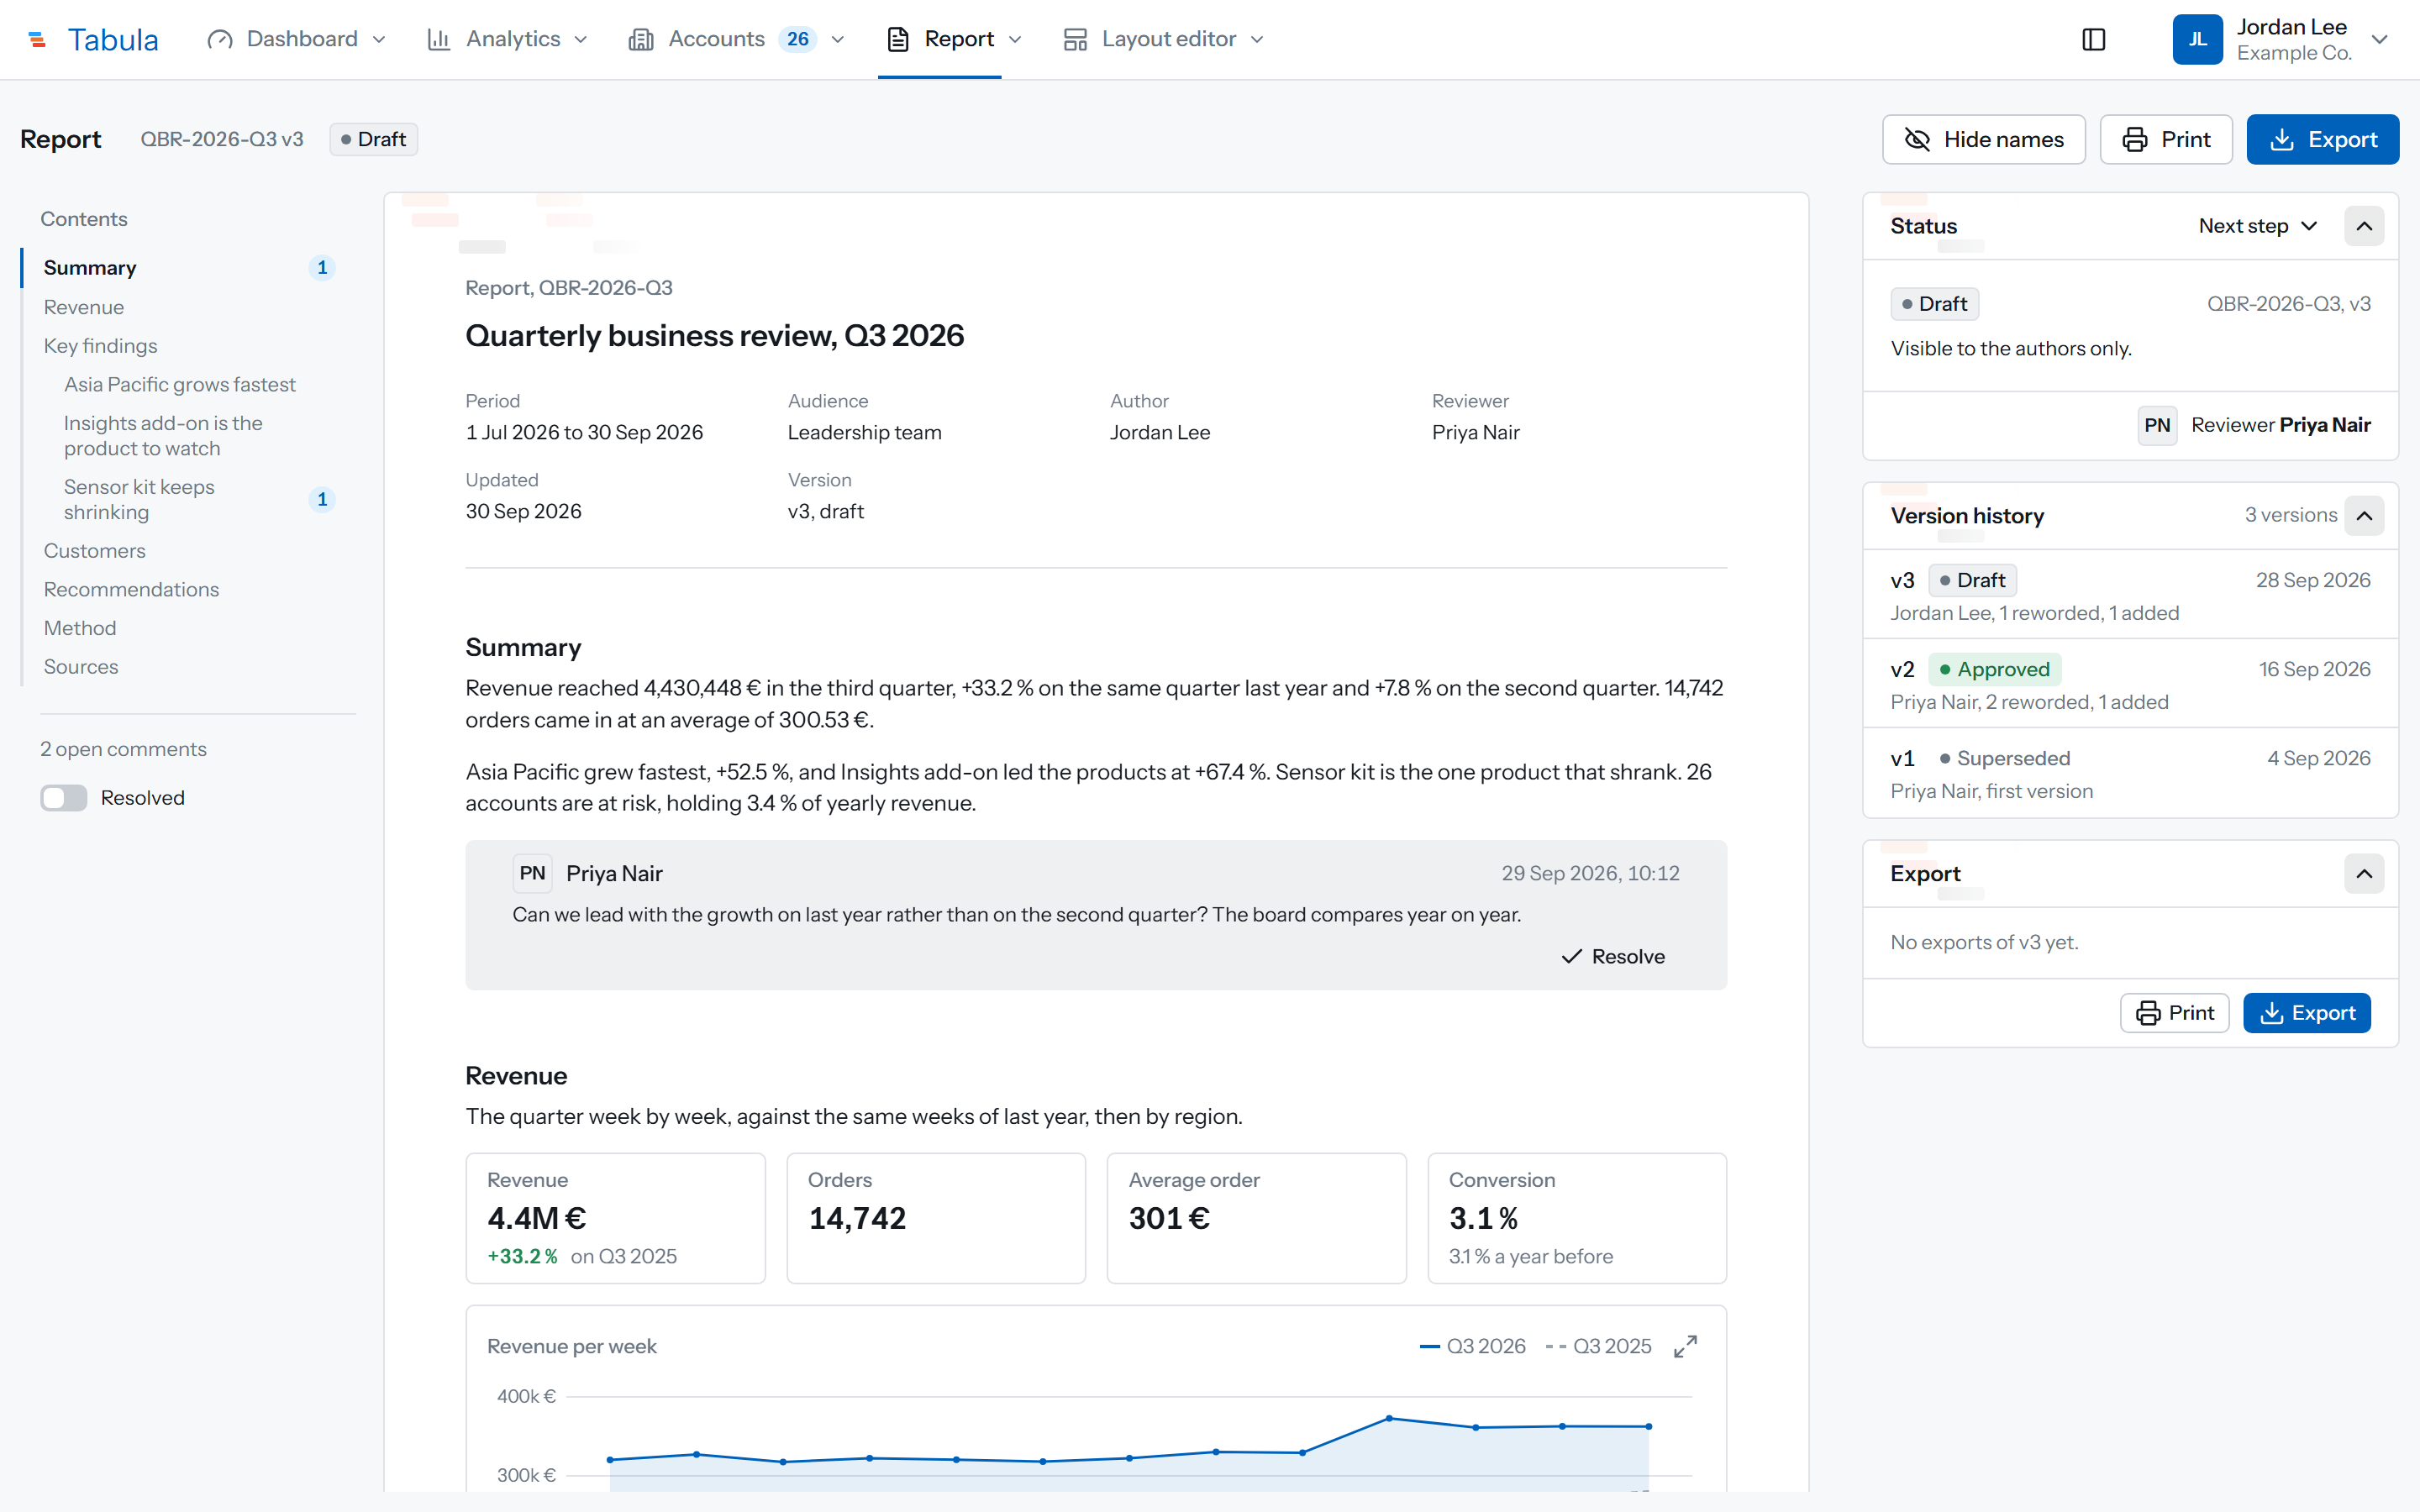
A report that goes through review
The quarterly business review is a document with an outline that follows the scroll, inline comments and a history for each section. Versions move through Draft, In review, Approved and Superseded, and any two can be compared word by word. The export dialog can hide account names.
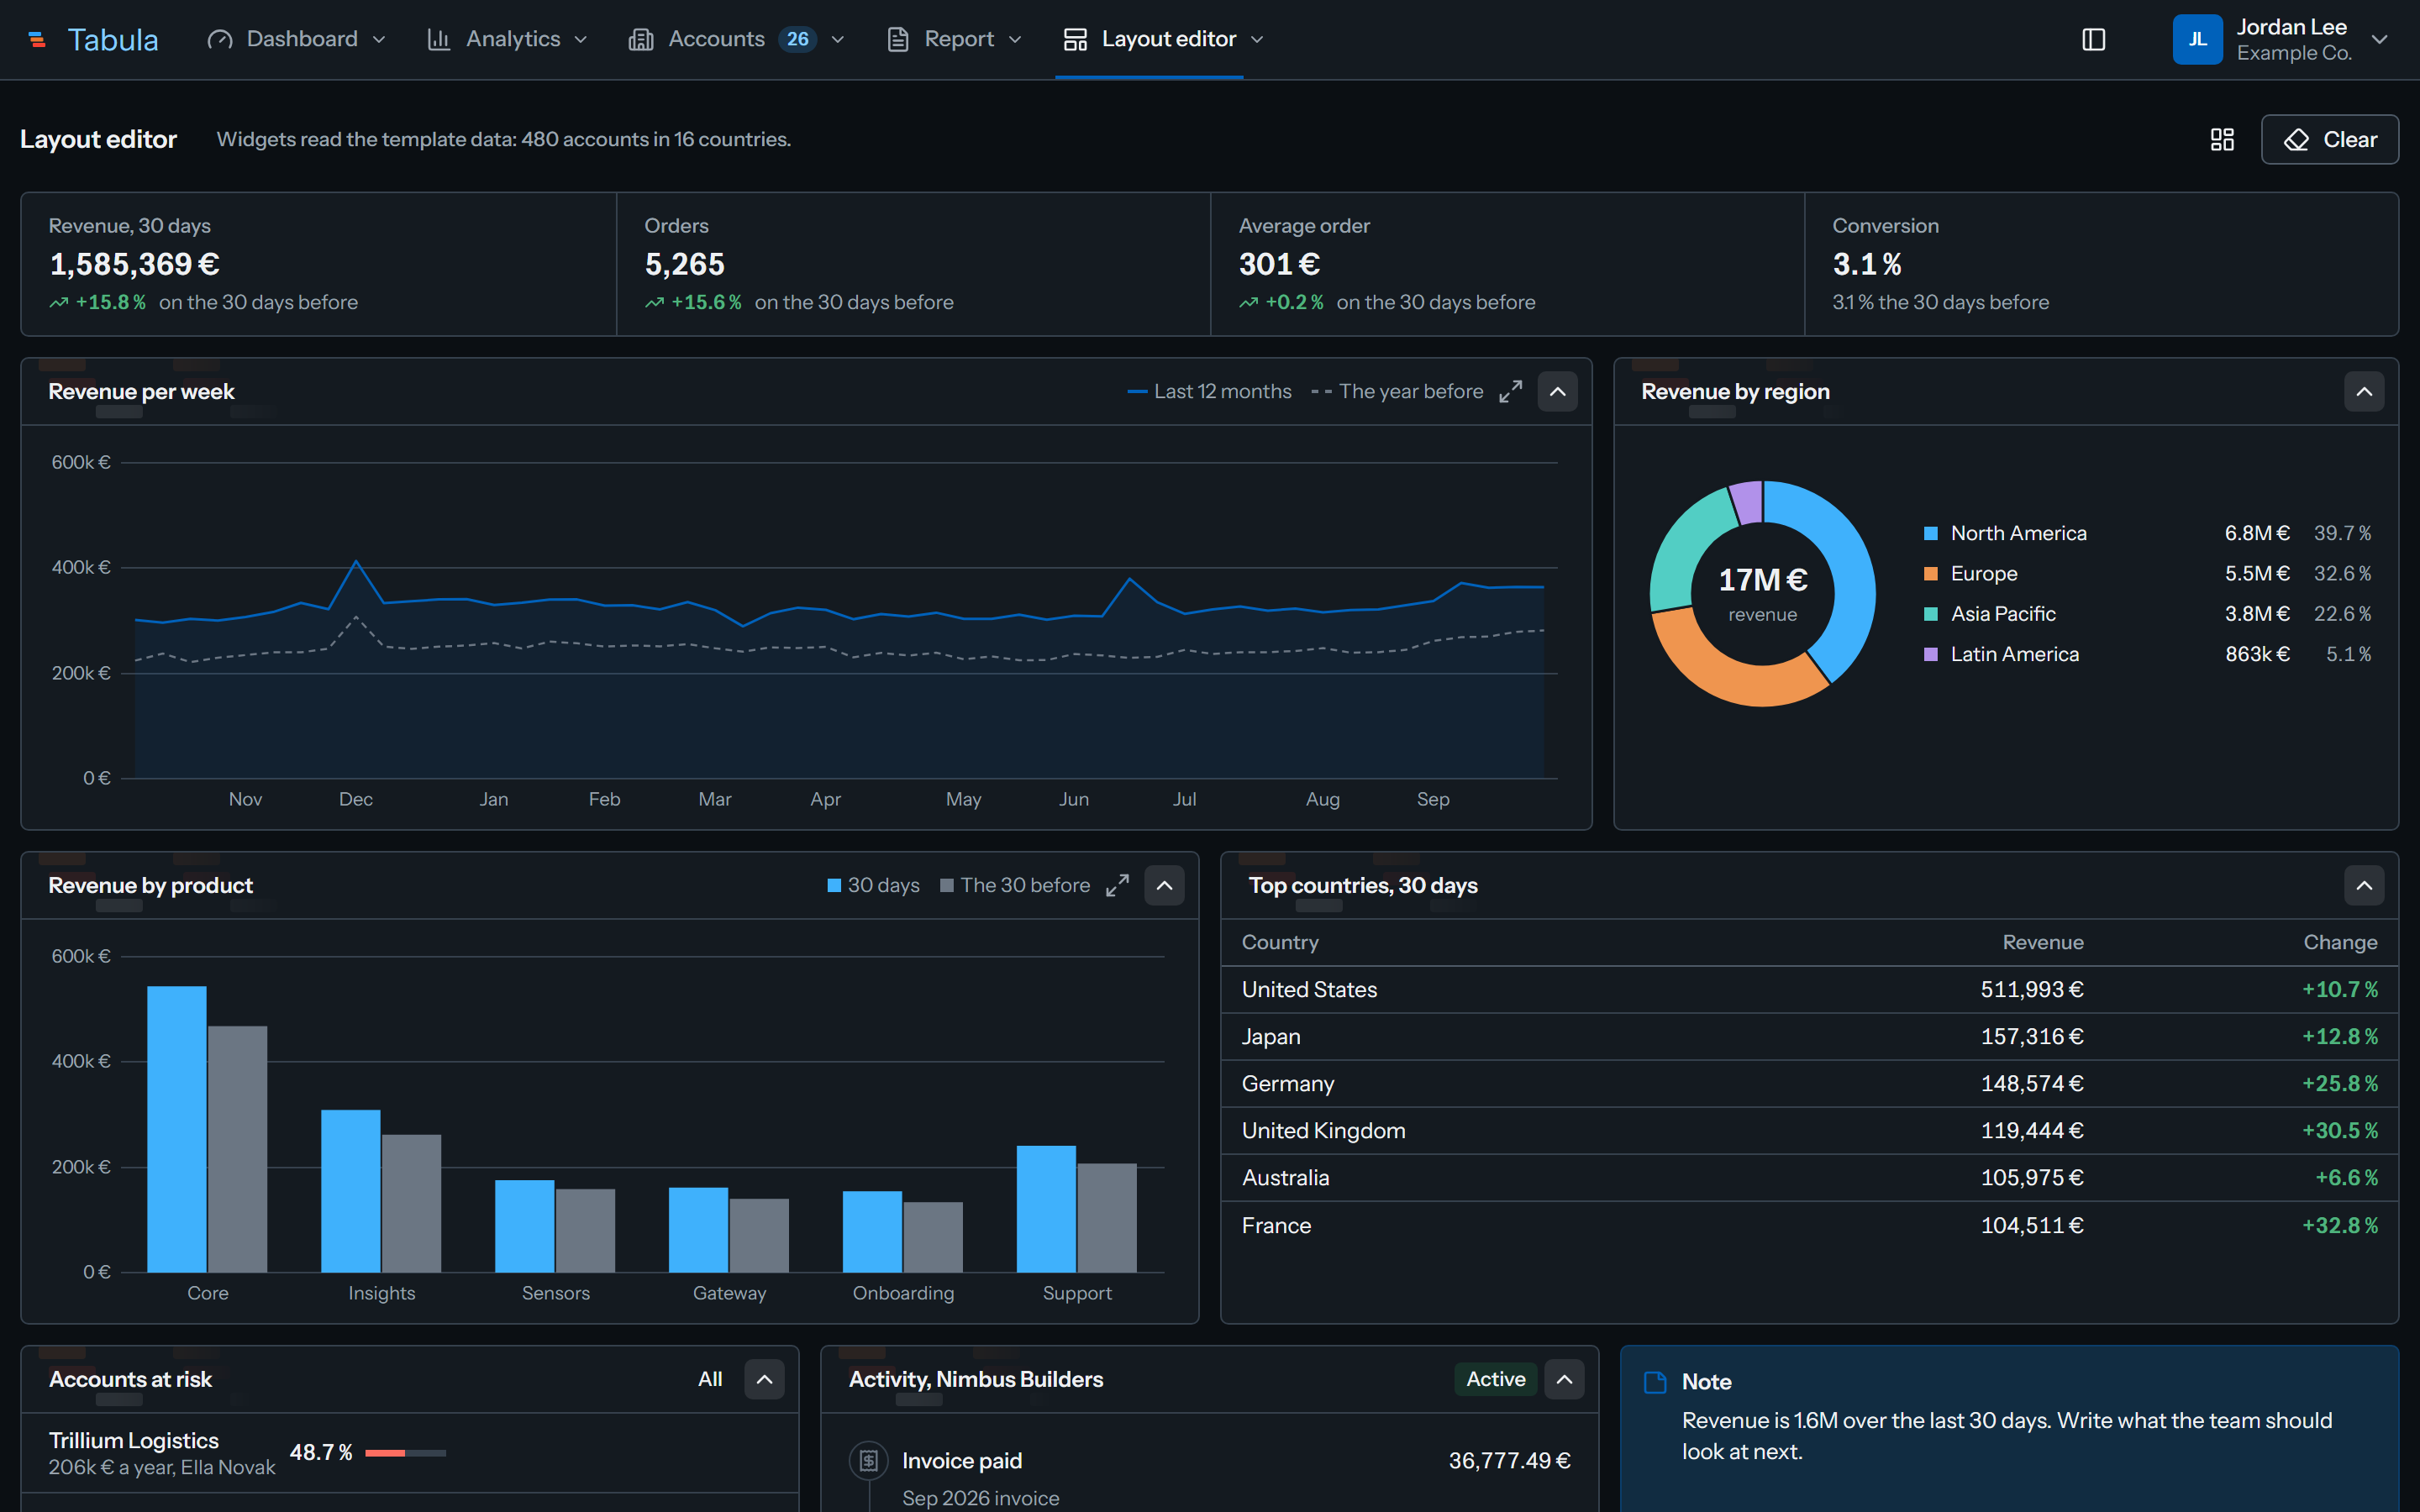
Start from a template or from scratch
The layout editor is a free page. It is laid out in rows of columns, and widgets come from a catalogue and can be dragged to move and resize. Each page saves its own layout.
Documentation for every part
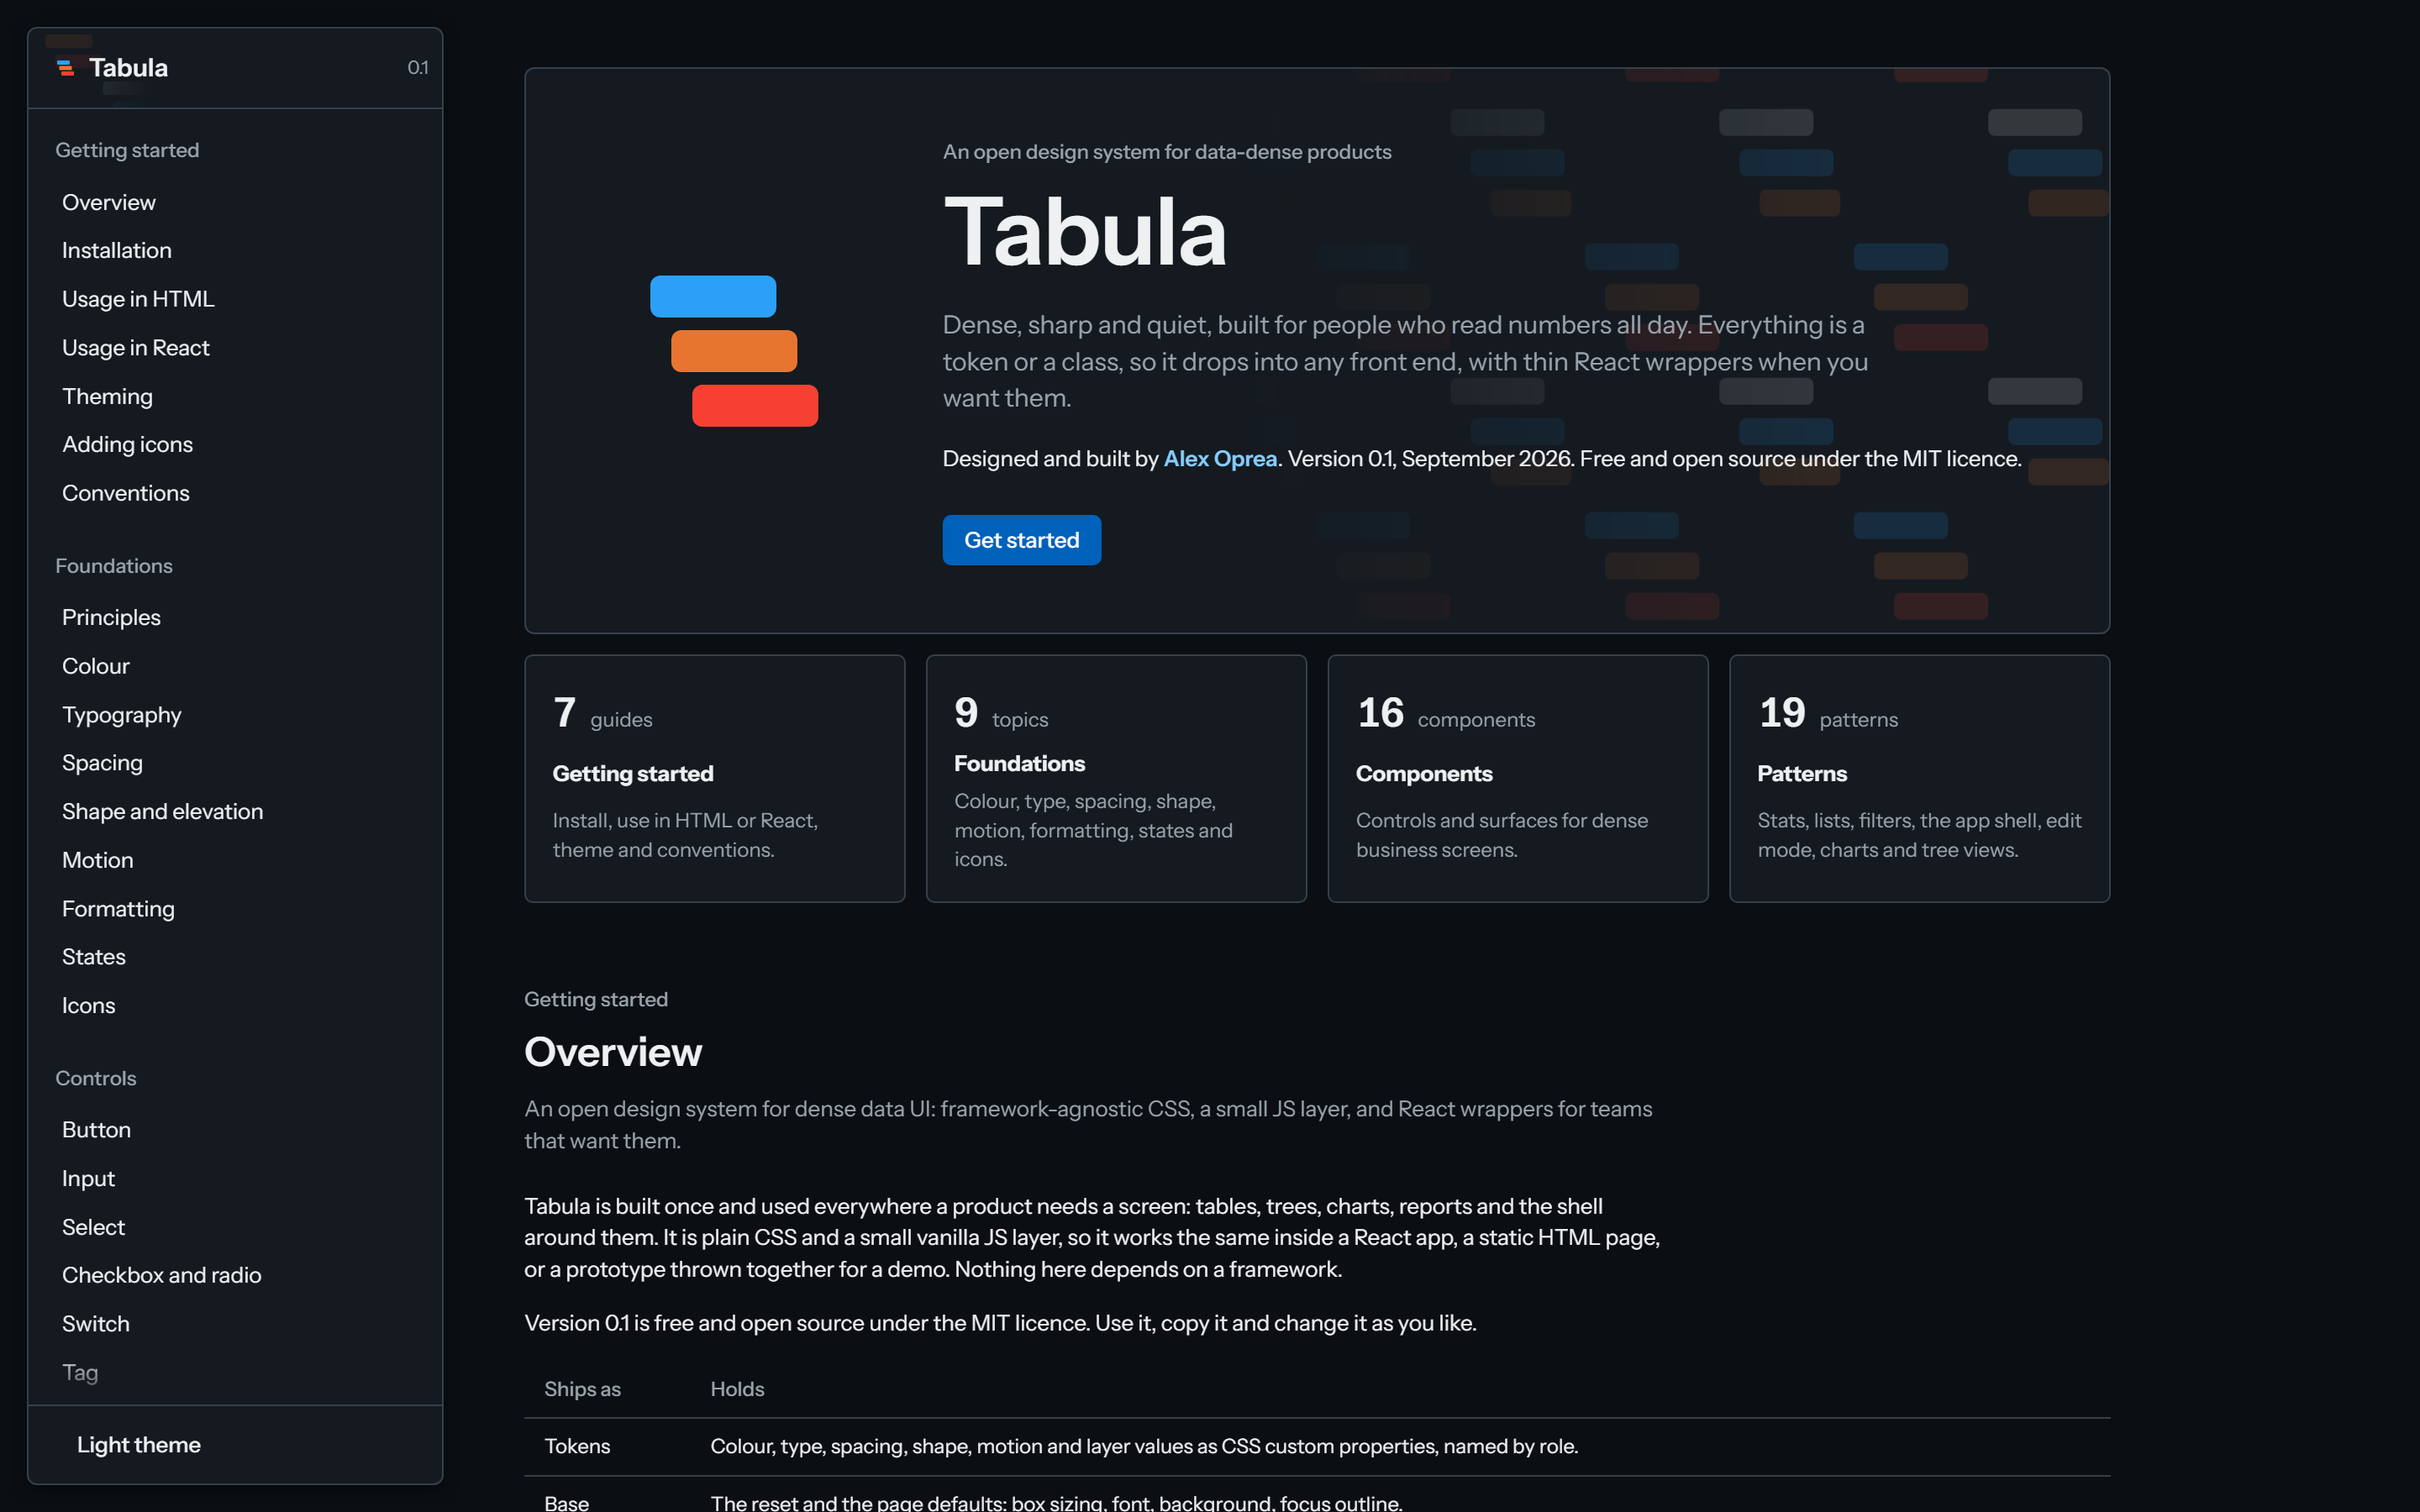
The documentation site gives each component and pattern a live example, the exact markup, the rules, and what to do and not do.